JMIA trade ideas

$JMIA looking interesting here....Did some DD on this, attempt to be the Amazon for Africa, ran huge on the potential, beaten down and consolidated here at this price level. Now still have to prove themselves, but have plenty of upside in between this volume shelf and ATHs. Next week $20's at $0.65 seem reasonable.

JMIA LongI see positive divergence on JMIA on the Daily chart. Momentum is building to the upside while the stock is consolidating. A break and close above the resistance line around $21.50 with a decent bullish candle and good volume will act as confirmation. JMIA can head to $25 or $32. I will wait and see what transpires

JMIA Break OutI like the double bottom in late August and early October. The last daily candle tested 2 fibonacci levels and closed above the .5 level while also closing above the descending (weekly) trend line. In addition the MACD is crossing over and the current price is in close proximity to the POC line (90 days).
Anticipating some resistance at $21.25 and then targeting: $23.85 and $28.07 in the short term.

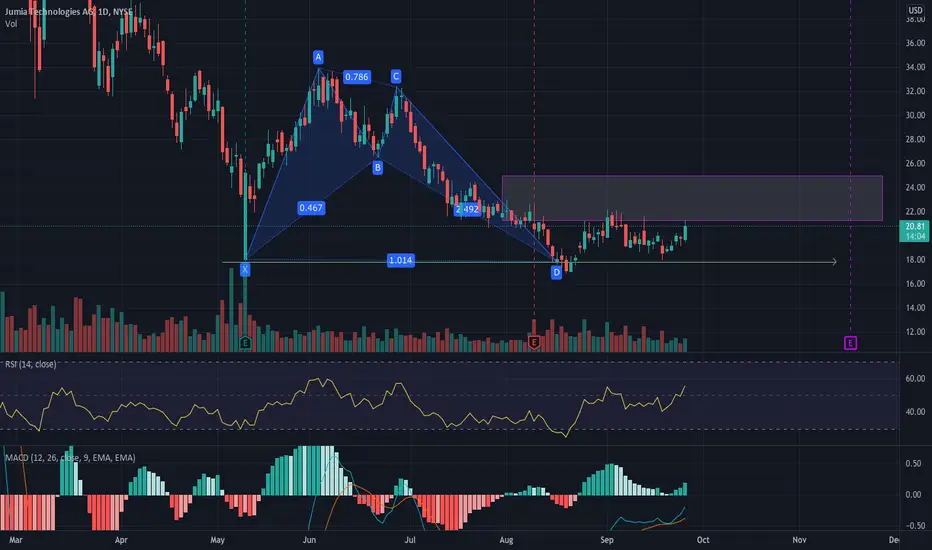
head and shoulders on JMIAWaiting to see if it breaks below the neckline with at least 2 bearish candles before initiating a short position. Negative EBITDA with negative revenue growth YoY.

$JMIA possible entry pointOn the log chart, you can see a clear upward channel that was broken but looks to be turning around now with a double bottom reversal. RSI is back at 50, the stock is trending upwards and MACD looks coiled.

JMIA last dip before big breakoutJMIA
JMIA has already broken the downward wedge resistance and looks like it's doing one last dip before bouncing off the support and breaking out.
Looks like at least 2x potential in the short term, but I'll be holding long term.
Bought at $19


JMIA Downward Price ChannelJMIA set to break the downward price channel soon.
If its breaks $21.6 and closes above it next target is above $29.

JMIAJMIA trending up and testing resistance of $21.25.
Should break it and get into the buy zone above it.
JmaiAfter a long brutal fall. This could finally be setting up. There’s a clear inverse head and shoulders formed on the MACd and RSI as well as an ascending triangle here waiting to breakout. We have held on to support and look ready to start an uptrend potentially. All we need to do is clear 22.79 and hold above and for an even earlier entry a break above 20.40. A lot of these low cap stocks are showing life again.

JMIA JMIA is down big of recent high of $68. I am long this for a swing trade. I am using the horizontal levels for areas of interest, and I think around $40 is doable before the end of 2021.

$jmia jmia correction ending WXY formation from a bunch of ABC and 1-5 corrective waves
Looking at support now from previous waves


Trendline - on demand zone Jumia have rebound on the trendline from early 2020 on the previous top at 18 where is the demand zone.
There is an harmonic bullish Crab right before giving a bullish information we can imagine a first target around 30$ for around 40% gain

$JMIA - may be reverse point$JMIA - Technically, the paper pushed off the trend from March 2020. If it exits the wedge, it could shoot up. In case of exit from the wedge, growth targets $27.5 -> $33.5
It's my personal opinion and is not investment recommendation.

JMIA LongWonder if we can hit those stops, above second line is the first stop most obvious level, if we can cross that level we might get momentum. If we cross previous week open we may also target august open by september.
Not a recommendation, is just an idea I had.

Jumia Ready to run.So right now were very very oversold, its come down to Fib level and a massive support level. its formed a cup and handle and a falling wedge. its poised to run africa which is a continent thats 10 years behind America. This to me is like buying amazon back in 2008. China will likely be involved i mean its a BUY and HOLD no doubt

Jumia Technologies $JMIA - Bullish idea 💡 ⚠️ This idea is based on my technical analysis only. Do your research and trade on your own risk!

watching $JMIAAn overhyped stock, dubbed to be one of the "$AMZN wannabes" cohort. We see absence of buying pressure on the daily and weekly chart (no green bars). This implies no interest in buying dip, the last green bar seen had its low broken --> dip buyers got hurt.
However we see it printing the daily 9 and sequential 13 and potentially a weekly 9 next week. Demark indicators are great at signaling selling exhaustion TIMING, although needs to be confirmed by price movement. I use these High-Low-Close bar and a coloring rule based on percent change and golden ratio to be my confirmations.
I want to see green bar daily printed and have its high broken. Ideally by more green bars.

$JMIA - In the buy zone!Bouncing strong off its debut price of $17 as major support I'm taking my shot today with entries below $18/share
Stop loss with a close below $16/share
Target 1: $22 (+25%)
Target 2: $25 (+40%
Target 3: $31.50 (+75%)
Target 4: $41 (+125%)

JMIA daily FibDont know if I am even doing this right but is this how you would look at potential downside PT zones using fibs

JUMIA on watchlistBack in a very good price range, now we have to look out whether we resume the trend back up.
