Buy KEX stop at this $PRICETest
Buy KEX stock at this $PRICE
Buying now because my indicator at 4 hours and 1 day chart give me the BUY SIGNAL
KEX trade ideas

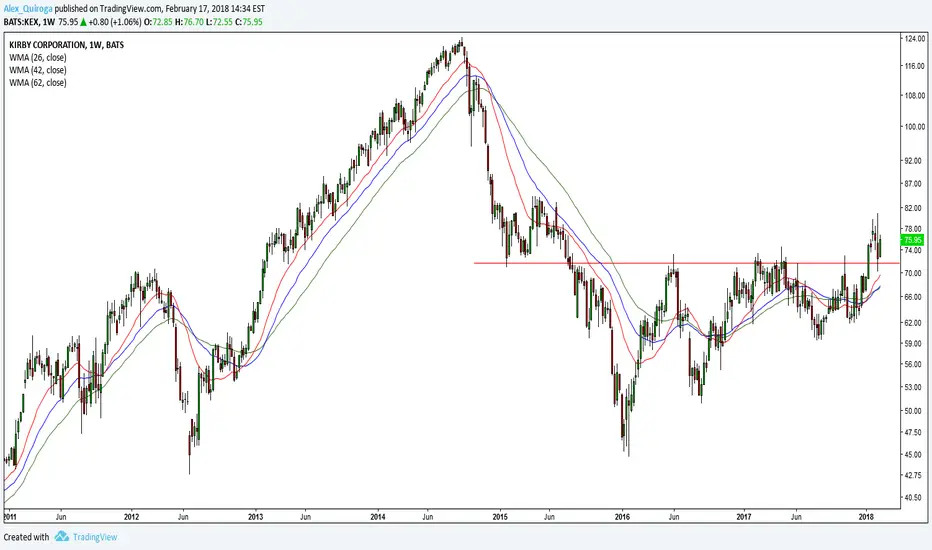
$KEX Kirby Corp - Breakout Continuation$KEX Kirby Corp
Big breakout today above recent resistance - once above $65 the move to $75 looks unobstructed.
🚨Unusual Options Activity🚨
14k April $75 calls bought today for $2.4M (95x open interest)
Near term target: $75.00

Possible breakout on two indicators for KEXKEX beat its previous high on June of 20 as you can see with the horizontal price level.
It also had a breakout of a trend channel its been in since November of 20. Todays daily candle broke out of both trends with decent volumes. They also just had a good earnings call. This could be a strong breakout with the proper support and volume.

KIRBY CORP Idea DailyHello traders, KIRBY CORP is in a fake downtrend with a doji accompanied by a sellers trace and a purchase volume returns made. In the TIMEFRAME M1 we observed a marubozu acceleration with a large volume executed it goes towards its next lowest which is in a bearish breaking gap. And being able to make a reversal, it is plausible to breakout the price and then at the same time test a stabilization zone. That it will breakout just after arriving in a new area and go to the next top (See confirmation on TIMEFRAME H4 and H1).
And if the buyers are still in the process, go to the top afterwards to fill the bearish breakout gap seen from excess (on TIMEFRAME H4 and back in Daily). No force to reach half of the middle median of the ANDREWS PICHTFORK range.
Please LIKE & FOLLOW, thank you!

KEX - Triangle FormationI think KEX will break out soon based on the triangle formation, but I am not sure in what direction. It also has a double top - so in the short term, I would go short.

KEX!Hi again! I'm liking this setup! Certainly won't be overnight, but I have a feeling we can punch through up to the 88-89 dollar range. With earnings out of the way, I can relax into this one.

Weekly flat top break with micro wedge - Considering Teir 1 hereChart interest me too much not to publish an idea on this. Not taking action right this second
RSI and MACD likely test their supports here. If we bounce it is definitely a buy. I will take a teir 1 position at the least there.
RSI is in the right zone for a move higher here it seems.


Look and do not thinkTargets, Position Sizing, Stops Loss and other things are at the discretion of the traders.
I already fulfilled my part: (Find Price Patterns)

Kirby Corp. stock set to reboundKirby Corp. shares have been trading lower for more than two months. A second downturn on the daily chart showed the formation of RSI divergence, which is a strong bullish signal. If the stock closes out the session above USD 88, there will likely be a bullish signal with a target price of USD 97.
My forecast participates in the Market Forecaster contest. Follow the link to vote for it and help me win the top prize. Thank you.
