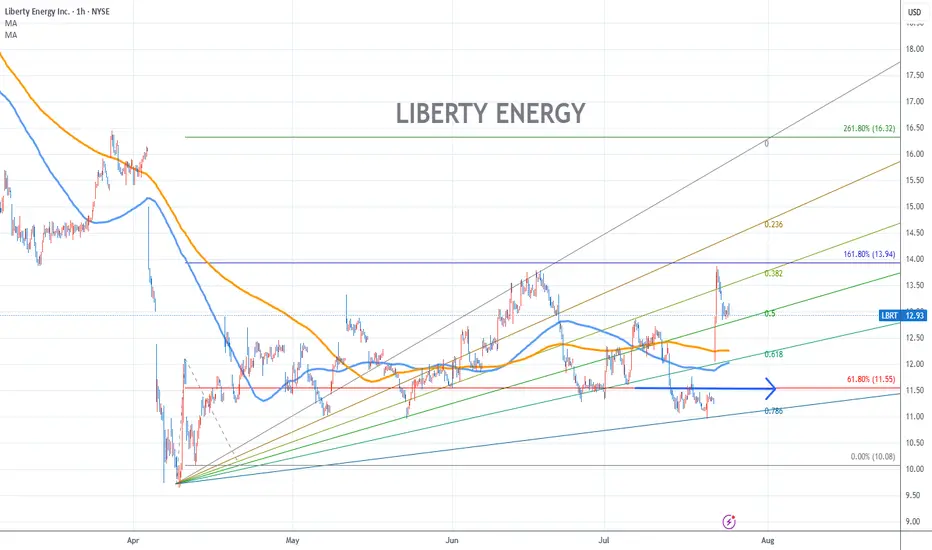
LIBERTY ENERGY Stock Chart Fibonacci Analysis 072425Trading Idea
1) Find a FIBO slingshot
2) Check FIBO 61.80% level
3) Entry Point > 11.6/61.80%
Chart time frame:B
A) 15 min(1W-3M)
B) 1 hr(3M-6M)
C) 4 hr(6M-1year)
D) 1 day(1-3years)
Stock progress:A
A) Keep rising over 61.80% resistance
B) 61.80% resistance
C) 61.80% support
D) Hit the bottom
E) Hit the top
Stocks rise as they rise from support and fall from resistance. Our goal is to find a low support point and enter. It can be referred to as buying at the pullback point. The pullback point can be found with a Fibonacci extension of 61.80%. This is a step to find entry level. 1) Find a triangle (Fibonacci Speed Fan Line) that connects the high (resistance) and low (support) points of the stock in progress, where it is continuously expressed as a Slingshot, 2) and create a Fibonacci extension level for the first rising wave from the start point of slingshot pattern.
When the current price goes over 61.80% level , that can be a good entry point, especially if the SMA 100 and 200 curves are gathered together at 61.80%, it is a very good entry point.
As a great help, tradingview provides these Fibonacci speed fan lines and extension levels with ease. So if you use the Fibonacci fan line, the extension level, and the SMA 100/200 curve well, you can find an entry point for the stock market. At least you have to enter at this low point to avoid trading failure, and if you are skilled at entering this low point, with fibonacci6180 technique, your reading skill to chart will be greatly improved.
If you want to do day trading, please set the time frame to 5 minutes or 15 minutes, and you will see many of the low point of rising stocks.
If want to prefer long term range trading, you can set the time frame to 1 hr or 1 day.
LBRT trade ideas
Liberty Energy Inc. (LBRT) - Potential Reversal Opportunity
LBRT has recently completed wave C of an ABC correction pattern, touching the lower trendline of a long-term ascending channel. This level aligns with the 1.028 Fibonacci extension ratio ($15.17), acting as a strong support zone.
Current Observations:
- Price has retraced to a key support level within the channel.
- RSI (14) is in the oversold territory (28.60), historically indicating reversal points.
- The confluence of Elliott Wave structure and trendline support suggests an upward move.
Potential Move:
A bounce from this support zone could lead to a bullish recovery towards the mid-channel range (~$17.42) and possibly retest prior highs (~$22-$25) if momentum builds.
A strong bounce here could signal the start of a new impulsive wave (Wave 1 of the next bullish cycle). Confirmation with increasing volume and a break above the short-term moving averages will further strengthen the bullish bias.
What are your thoughts on this setup? Let’s discuss!

Liberty Energy [LONG]The weekly chart for Liberty Energy ( NYSE:LBRT ) shows strong momentum as the price has successfully broken out of the triple bottom pattern and is nearing the overbought zone on the RSI.
Observations and Continuation:
As the price remains within an ascending channel, there is a potential to test the upper channel resistance, which aligns near the $25-$26 range.
However, with RSI trending into the overbought zone, there could be short-term consolidation or a pullback before further continuation. It is therefore prudent to watch out for signs of divergence that could signal a reversal scenario.
Key Levels to Watch:
Resistance: The upper channel boundary near $26.
Support: Price levels around $19 could act as a safety net if the price retraces.
Caution is warranted as the stock approaches the overbought region, historically suggesting reduced momentum or a potential pullback. Watch for trends in volume.
Bullish Scenario: A breakout above $26 could lead to a stronger rally, potentially targeting higher levels around $28-$30.
Bearish Scenario: Failure to sustain above $23.60 might signal consolidation or a test of the $20.50-$21.00 region.
Disclaimer: This is not financial advice. Conduct your own research and consider your risk tolerance before entering any trade.

Liberty Energy (LBRT) – Potential Triple Bottom Formation [LONG]Liberty Energy (LBRT) appears to be forming a textbook triple bottom pattern on the daily chart, signaling a potential reversal from its recent downtrend. This bullish formation is characterized by three distinct lows around the $16.50 level, showcasing strong support at this price range.
Key Observations:
Support Zone: The $16.50 level has held firm as support on three occasions, rejecting further downside and indicating potential buyer accumulation.
Volume Analysis: Increasing volume on rebounds from the support level suggests growing bullish momentum.
Breakout Potential: A breakout above $18.65 (the neckline resistance) could confirm the triple bottom pattern and signal the start of a strong upward move.
Technical Indicators: The RSI is trending upward from oversold territory, hinting at a possible bullish divergence. Meanwhile, MACD is approaching a bullish crossover.
Target Price: If confirmed, the measured move projects a price target of $23.60, based on the height of the pattern.
Disclaimer: This is not financial advice. Conduct your own research and consider your risk tolerance before entering any trade.

🛢️💹 LBRT Analysis - Fueling Growth! 💡🚀🚀 Expansion Plans:
Liberty Energy NYSE:LBRT : Provider of hydraulic services to the oil and gas industry.
Ambitious plans to double capacity of Liberty Power Innovations business.
Aiming to shift 90% of fleets primarily to natural gas by end of 2024.
🔝 Key Drivers:
Strategic transition as a key driver for future growth.
Launch of the Bettering Human Lives Foundation.
Commitment to strategic investments in technology and infrastructure.
📈 Trade Outlook:
Bullish Sentiment: Suggested entry above the $17.50-$18.50 range.
Upside Target: Set in the $28.00-$30.00 range.
🚨 Note: Market dynamics may influence outcomes.
Fueling the future! ⛽📈 #LBRT #StockAnalysis #OilAndGasIndustry 🌐🔥

LBRT: Ascending triangle, Not confirmed (111,12%)(29/1000)(29/1000)
Deleting this one by accident. Here it is again.
Ascending Triangle for LBRT on the weekly chart.
Not confirmed
Possible 111,12% gains.
As per graph on the right, energy sector (SPN) is building into an ascending triangle (not confirmed) with a possible 41,62% gain.
LBRT analysis:
Pros:
1- Bullish Ascending triangle
3- PPS above 50MA and 200MA
3- R/R ratio above 5
4- 250RSI above 50 and ascending
5- 50MA ascending
6- RS above 0 and ascending
7- 50MA above 200MA
8- Golden cross in bue
Cons:
1- 200MA flat
2 - ATR descending, less volatility
Target price is 38,55$
Stay humble, have fun, make money!
MAAX!


LBRT - Liberty Oilfield Services Inc (Potential Buildup)The RSI, Stochastic Indicator, and Support levels are all giving good signs of a potential increase in share price.
Right now I would rate it a "weak buy" until there is more of a confirmation of an upward motion.

Liberty Oilfield Services Inc - LBRTDespite having fallen out of its upward trend, I am still bullish about this stock for several different reasons:
1) The RSI is indicating that LBRT is nearly oversold
2) LBRT is capable of finding support at around $9.33
3) LBRT is currently undervalued based on yesterday's movements between high, low, and closing price.
4) Although downgraded, on August 03, 2021, "Morgan Stanley" gave a "$17.00 - $15.50" rating for LBRT. The price target was set to $10.05+1.2%.
5) Although downgraded, on August 02, 2021, "The Goldman Sachs Group" set their price target to $10.19→4.3%, giving it a neutral rating.
6) The overall consensus for a price target is currently $12.63, which is much higher than 180 days ago when it was $9.25, and only slightly lower than 30 days ago when it was $12.70.
7) The price target upside has only increased over the past 180 days from 14.42% to 31.52%
8) There appears to be a pattern with the earnings where it flips back and forth, so what are the odds of them being positive the next time around?
On the downside, volume fell today by -22.67% while the price increased by 2.89%. Taking that into consideration, falling volume on higher prices causes divergence and may be an early warning about possible changes over the next couple of days for the worse. It is highly volatile, which also makes people cautious about buying into the stock.
Here is my forecast for the last days of the remaining months of 2021. They are based on the starting point of the initial trend that came out of the lows from March 2020's decline:
Date | Forecasted Closing Price
08/31/2021 | $12.97
09/30/2021 | $12.96
10/29/2021 | $12.96
11/30/2021 | $11.32
12/31/2021: $11.33
On a scale of STRONG SELL, SELL, WEAK SELL, HOLD, WEAK BUY, BUY, and STRONG BUY, I currently give it a WEAK SELL for the time being until it starts showing some strength for any traders, but for people like me who are investing for the long term, this stock is a good buy.

Liberty Oilfield Services Inc - LBRTLBRT has been a short-term sell candidate since around 2021-06-28, having a loss of -15.90%, but I think that based on the current trend it is in, the stock should continue on upwards in the upcoming days.
A fair opening price for tomorrow (July 16, 2021) would be $12.25 according to StockInvest.us, so that would mean LBRT is currently undervalued at $12.06.

Liberty Oilfield Services Inc. - LBRTThere has been a good upward trend over the past year.
The RSI is saying it's overbought, and that can be backed up by the trendline, so DO NOT buy right now.
Your best bet would be to jump in at around $12.50, assuming the trend continues as expected.
Inflation should help this stock perform well.

LBRTLiberty Oilfield Services Inc (NYSE:LBRT) Nice volume on the breakout. Looks great for a test of the highs.

SHORT $LBRT: Corrective Wave Impulse Target Much LowerLong puts on $LBRT.
Corrective impulse is not finished: Strong resistance @ 10+; LONG PUTS: stop-loss @ 12.5 or even 12.3; expecting a massive trace-down that could see LBRT sub-8, or sub-7, by the conclusion of the second quarter.
This is not trading advice, but it is purely speculation on the long-term behavior of LBRT. This is a much-revisited stock for this trader, but it has been a while since we've stopped in on LBRT; It has fallen further & further behind $HAL Halliburton - which is the safer and better-investing choice in the $USOIL and field speculation sub-niche.
Best,
BDR

$LBRT Liberty Oilfield Making Bull Run with $USOIL: Exit-points?Well, FIB retracements were shattered to pieces with the BULL RUN $USOIL experienced on Monday's market open.
The only thing that makes any sort of sense here is to target a relative previous high as a potential early exit point. Of course, LBRT's high upside looms higher than this focus at 9.81, but there's already a sizeable profit on the entry point for this trader (sub-8.1), so a little caution must be exercised until we see $USOIL itself spike 43/b with little resistance-- That has not happened in "COVID SZN," and while it appears closer to reality, it's still not here.
So, PROFIT- SNATCH at the Checkmark, but Stay 1/2 position for the later secondary run that still could loom. Hedging as it is.
Happy trading - and this isn't advice; it is simply my THOUGHTS, and what my IDEAS, are leading me to do with all my positions ;)
Which is advice, for me, and you if you choose - but we're only calling it IDEAS, ya feel?
-BDR
Post note: See related idea on $USOIL for the precursor to this IDEA!

Liberty $LBRT falls past first previous low stop; SUPPORT?!$LBRT re-tested a previous trough @ 6.44. It found some good support at that line, but it is now starting to dip below it. We are thus targeting 5.6/s as the rough area for it. Considering a top out was previously called at 10.44... this is a 100+% ROI on a mega-long-swing. That said, be patient w/ entrance and also with exit -- if you like "quick results," this isn't your play.
See also the related idea wherein these entry points were first charted (more of a Proof than any reason to really read it - most of the same things were just said here, but it's an update).
HAPPY TRADING, Bears & bulls!
(I am a bear today anyway)
-BDR

Could LBRT re-test Lower regions? Target Entry-Points (BEARISH!)Liberty and the oilfield industry is taking a hit: This looks at two previous dips that could be realized soon. We will be watching to see if LBRT gains support at any junctures and figuring out some support lines later in the trading week.
This is mostly a willfully cautious projection of two dip points that would make GOLDEN entry points to $LBRT to swing a LONG after that.
It has failed the support a VERY strong trade channel previously established - that said, **many** positions are showing similar trends so it's tough to ignore the overall action in the markets.
6.44 and 5.61 are NOT inconceivable with an overall market crapping, at least not in this trader's opinion. Even at that type of nadir, the target would still be 9+ on an (eventual) recovery.
-BDR

Liberty LBRT showing enough strength thru COVID Correction "SZN"Liberty has been rising while OIL has found a massive resistance over 40/bar.
In the period oil has traded sideways, $LBRT Has rose: This is an overall very good sign.
Ultimately, the oil must return to 60+ per barrel but it is nowhere close, and the entire oil trading industry lingers in this cesspool created by a pandemic, a scare of impending crisis - and many buy-points on oil and oil-related stocks that have just sprung up in circular and cyclic fashion as always.
Pitting these charts together does tell a story.
See also, related idea Re: OIL vs LBRT's potentially GOOD earnings report!
-BDR

Liberty $LBRT reports Earnings Tues. But $USOIL Is Bed-crappingA great earnings report by Liberty may be mitigated in effect by $USOIL falling below 39/bar as of just before this week's market opening.
The overall weakness of oil could cap any rises LBRT may have incurred from a potentially good earnings report. That's a thought, anyway. There is nothing else to add to this. LBRT is down pre-market and it might be a time to enact a short-repositioning depending on how the overall market responds today to some ominous signs in future's (oil commodity especially) trading.
GL and what-not!
-BDR

Liberty $LBRT Trade Channel Places Target at 10.44Liberty has traded on a wide channel since exiting its March low.
The high-upside, exit-point that we are targeting is 10.44 on this swing.
With LBRT trading at 7.8 right now, this should represent roughly a 33% ROI on a rather patient, long-term swing.
Always do your own research. BDR is not infallible nor a guru: These are ideas; not advice.
Happy Trading!
-BDR

LBRT Fracking Its Way to the TOP of niche-industry: BUY, LONG.I could spend time pouring over the harmonics of LBRT, and in the past, certainly, we've done so here. No real sense even peppering this later w/ the links that proliferate my page (Particularly for HAL, its sister - rival, stock. There's enough LBRT talk too).
Today isn't that.
Today is to say that LBRT's recent strength through a very tough time for USOIL and its prospects, is a flashing a rather clear BUY NOW window. It is barely sub-8/s, and it won't stay there.
The recent fracking acquisition-merger (Schlaumberger is close to the spelling or something, forgive me LOL), the overall feeling: Is that dumping HAL, SOI, other oilfield companies...to 100 percent divert the funds into LBRT is fully smart. That sounds a lot like advice, but it's actually not - It's just this trader's plan. Disclaimers aren't necessary, but they don't hurt.
LBRT to the moon. Take profit is beyond 10 per share at least, and that won't even be prospected until it's closer to that mark. But do what thou'st may - and GL To any & all. LBRT is wagering fracking has some fracktatcious profit still to be exacted, are you not?
-BDR

Liberty $LBRT Traces top Fib @ 6.7; Upside Looms Higher- LONGNow is a good time for those waiting on COVID oil corrections: LBRT fell below 6 per share last week, and it provided a GOLDEN ENTRY POINT for the Long now en progress. Oil is 43+ per bar. and most oil commodity traders are LONG on $USOIL -- the same logic applies to Liberty Oilfields. Expect the real gains to follow the rest of the week with oil starting out strong (through the first half of Wednesday's trading).
Fib retracements show a sell-point @ about 6.7/share--but this, like the play on Halliburton is going to be a longer-swing than that. The eventual hope is that annual highs are realized within the next 5 to 10 months, with that window being generously huge simply due to the fact COVID itself is dictating so much; with so much of that predicated on the unforgivable whims of human behaviors. This trader will wait until $LBRT is closing in on 10 per share. The exact sell-point can thus be calculated at a later date...
Even so, the realization of a **HIGHER ROI** is there with Liberty (compared to $HAL); it could still be 60+%, whereas HAL's remaining correction is more along the lines of 30-40%.
Both make nice plays, though this was supposed to be devoted to Liberty explicitly. The sector of the economy is strengthening and the comparison (between similar companies) is worthwhile, even so.
HAPPY TRADING!
-BDR

Old support New ResistanceThis is stock has been on a downtrend since 2018, two gaps were created on the way down which is represented by the green lines.
Now the stock in on its upward trend, old support from 2019 is now the new resistance with the top (now bottom) of the gap being new support.
Please leave me a comment it will help me to improve my trading skills.
