LDOS trade ideas

Leidos Awarded Contract to Support the Office of the Under SecreLDOS: Leidos
2020-10-29 08:00:00
Leidos Awarded Contract to Support the Office of the Under Secretary of Defense for Personnel and Readiness

Leidos Awarded SOCOM Tactical Airborne Multi-Sensor Platforms (SLDOS: Leidos
2020-08-10 08:00:00
Leidos Awarded SOCOM Tactical Airborne Multi-Sensor Platforms (STAMP) Follow-On Operational and Support Contract for Program Manager Sensors - Aerial Intelligence (PM SAI)
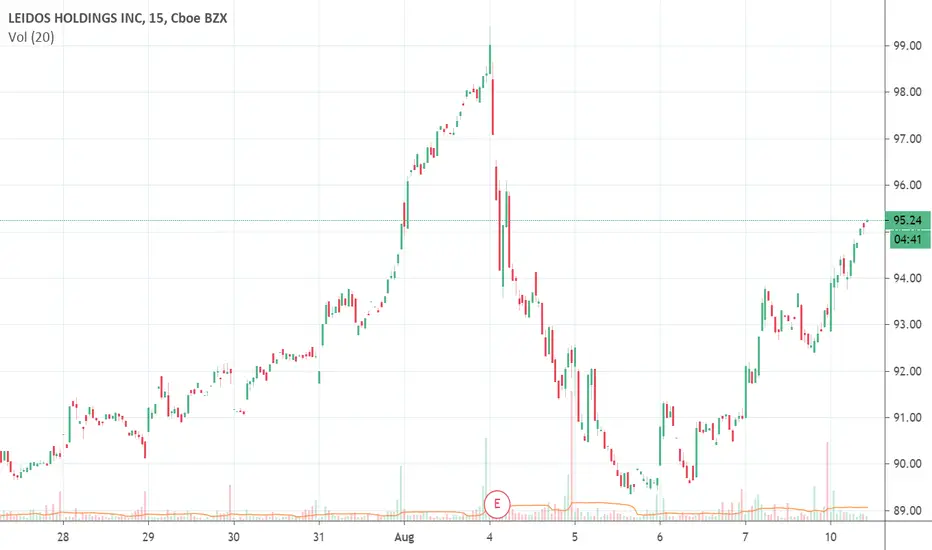
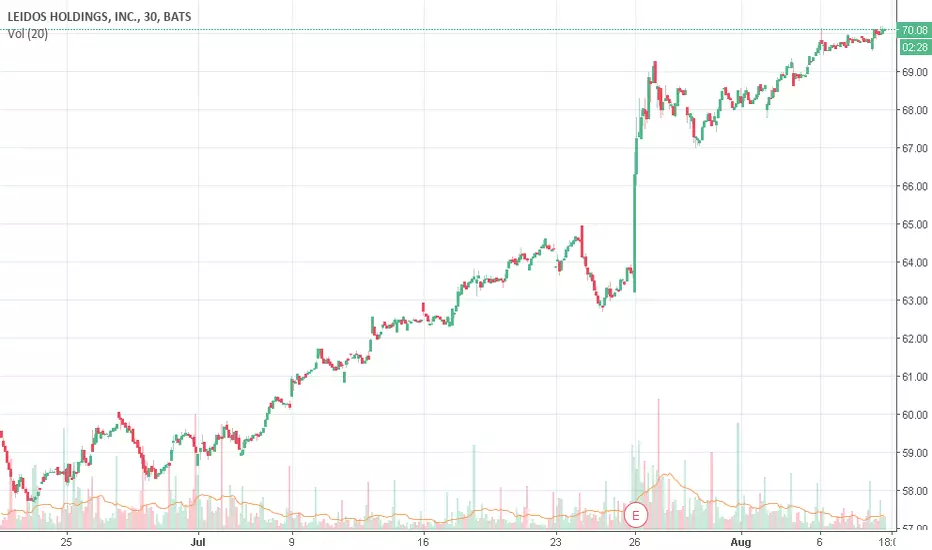
LEIDOS HOLDINGS Strategy DailyHey guys, LEIDOS HOLDINGS is in a bullish continuation, large buying volume executed with the several buying volumes from before and it is plausible that it rises to go down. LEIDOS HOLDINGS go over its previous above, sellers must report back to buyers' transactions.
Please LIKE & FOLLOW, thank you!

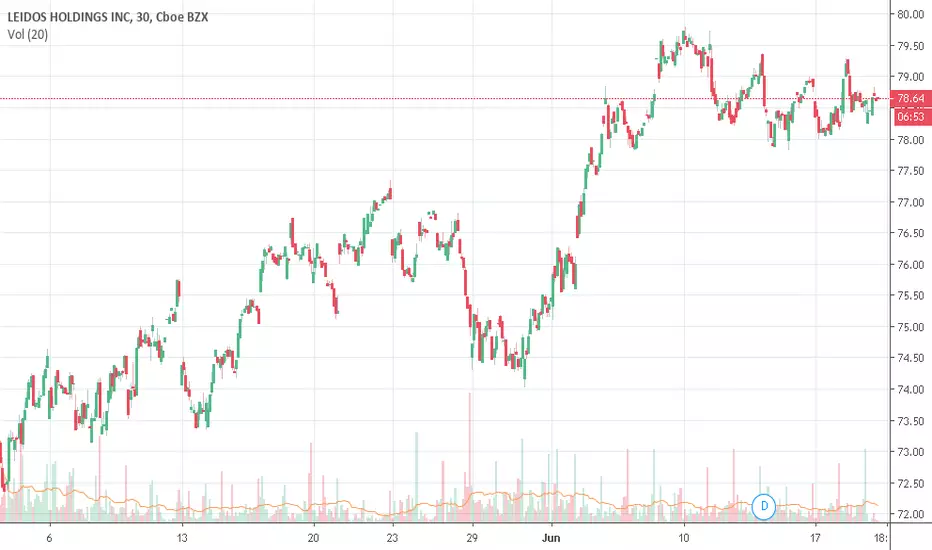
LDOS bullish regular divergenceLDOS is showing bullish regular divergence on its 4h and 1d charts. It is also nearing support inside a falling wedge.

Leidos Awarded Traveler Processing and Vetting Software ContractLDOS: Leidos
2020-07-01 16:30:00
Leidos Awarded Traveler Processing and Vetting Software Contract

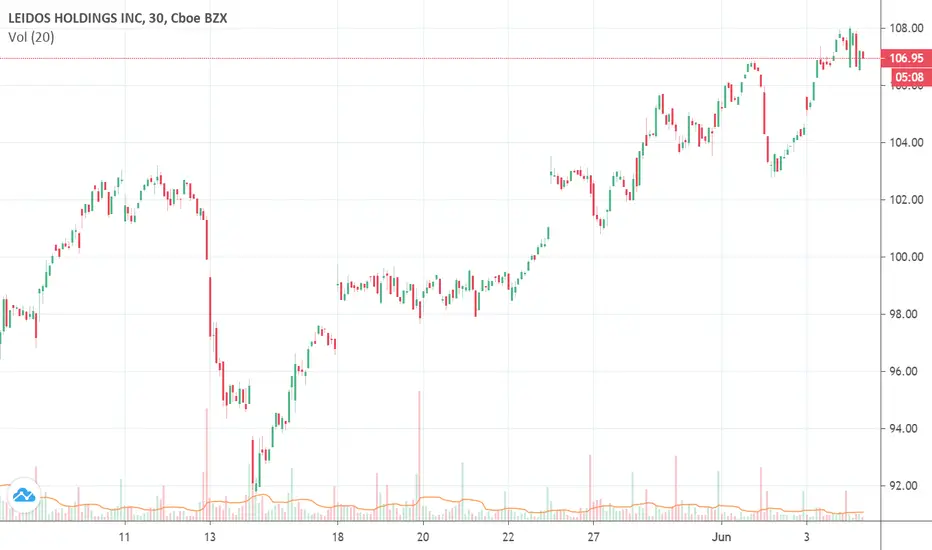
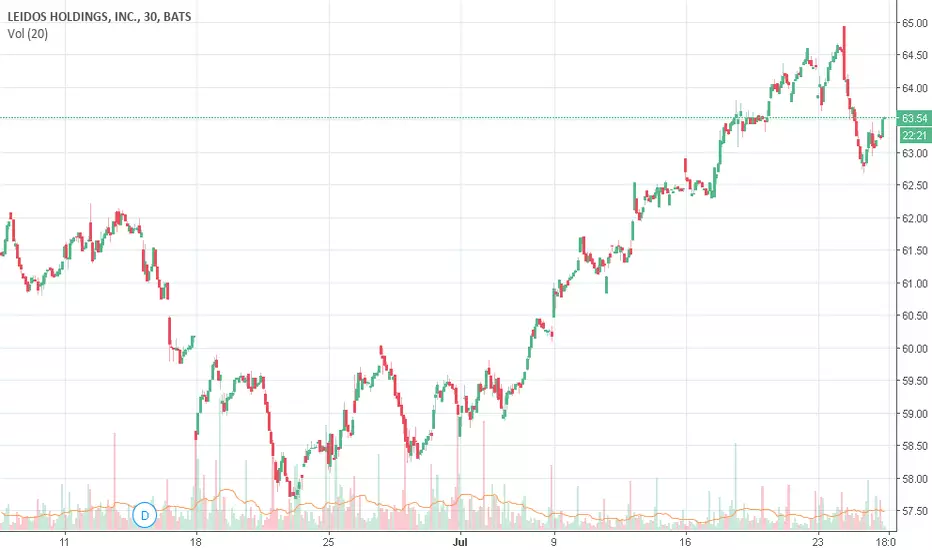
LDOS is in uptrend and our signal showed a trigger for LongM30 chart in uptrend from our system signal!

Leidos Awarded DIA Enterprise Infrastructure Operations ServicesLDOS: Leidos
2020-06-03 16:30:00
Leidos Awarded DIA Enterprise Infrastructure Operations Services Contract
Leidos Awarded FAA Mode S Radar System Modernization Contract!!!LDOS: Leidos
2020-01-29 16:30:00
Leidos Awarded FAA Mode S Radar System Modernization Contract

Leidos Awarded TSA Screening Equipment ContractLDOS: Leidos
2019-10-14 16:30:00
Leidos Awarded TSA Screening Equipment Contract

Leidos Announces $200 million Accelerated Share RepurchaseLDOS: Leidos
2019-08-01 06:00:00
Leidos Announces $200 million Accelerated Share Repurchase


Leidos Awarded Contract to Support Counterintelligence OperationLDOS: Leidos
2019-06-18 16:30:00
Leidos Awarded Contract to Support Counterintelligence Operations
U.S. Navy Awards Leidos Contract to Support Aircraft Readiness LDOS: Leidos
2019-03-13 06:45:00
U.S. Navy Awards Leidos Contract to Support Aircraft Readiness Worldwide - PR Newswire

Leidos short idea - 200MA and FibonacciNYSE:LDOS bounced back from 200MA. RSI and Stochastic RSI are in the overbought area. I am expecting a bearish reversal here on the D1 chart.
Entry strategy: wait for a bearish confirmation candle which cross below 61.27
If you think this analysis is useful and you want to receive new updates about this idea, leave your comment or your LIKE!
Thank you for your support and may the markets be with you!

Leidos Announces $200 million Accelerated Share RepurchaseLDOS: Leidos
2019-02-21 06:45:00
Leidos Announces $200 million Accelerated Share Repurchase

Leidos Awarded Social Security Administration Contracts for OffiLeidos Awarded Social Security Administration Contracts for Office of Software Engineering and Disability Case Processing System
2018-08-07 16:15:00
LDOS Detected possible contract awarded!!!LDOS: leidos holdings inc
2018-07-25 06:18:11
Detected possible contract awarded
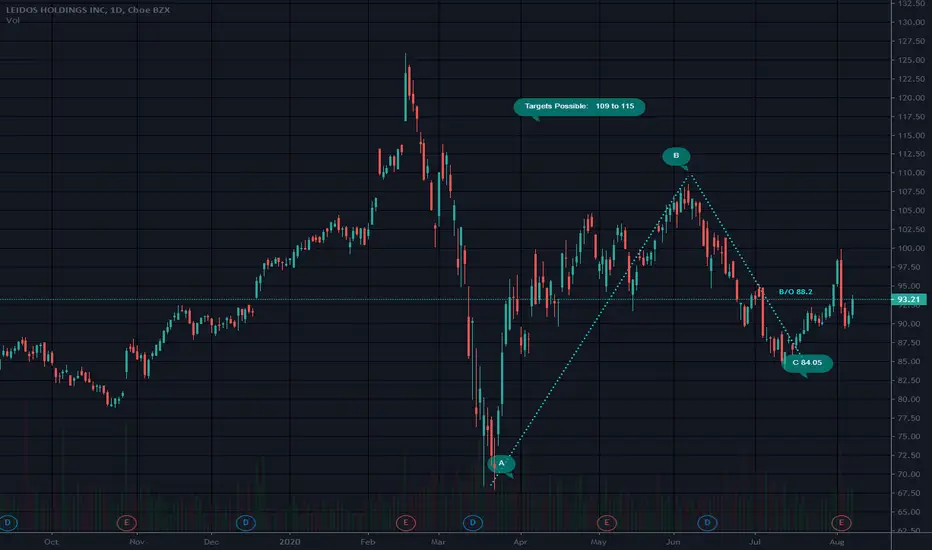
possible breakout?What do you think about this set up ? Are my targets set up correctly? I placed my targets using 2x Fibonacci levels. Using a 1:1 ratio from the larger trading range and the smaller range. Current price levels are also near a pivot point from a couple of months ago. If it breaks over that pivot point i believe it will go much higher.

Leidos To Give Some BackLeidos has been in a bullish trend since last year. During this course of this trend, the stock has move down after hitting resistance. This resistance was struck once again on May 25. May 25 also paved the way for a double top, which is a bearish signal. I will outline why the near-term movement is likely to the downside below.
When we take a look at other technical indicators, the relative strength index (RSI) is at 63.7117. RSI tends to determine trends, overbought and oversold levels as well as likelihood of price swings. I personally use anything above 75 as overbought and anything under 25 as oversold. Currently the RSI is overbought and due to drop. This indicator has not received overbought territory since the end of February. However, this indicator has been trending downward preventing newer highs. Currently, this oscillator is at the resistance point it has been reversing at. This is the first indication of potential downward movement in the near-term.
The true strength index (TSI) is currently 8.0001. The TSI determines overbought/oversold levels and/or current trend. I solely use this as an indicator of trend as overbought and oversold levels vary. The TSI is double smoothed in its calculation and is a great indicator of upward and downward movement. This indicator has also had resistance similar to that observed in the RSI oscillator. Once again the indicator is near that level of resistance. This is the second indication of potential downward movement in the near-term.
The positive vortex indicator (VI) is at 0.9866 and the negative is at 0.9193. When the positive level is higher than 1 and higher than the negative indicator, the overall price action is moving upward. When the negative level is higher than 1 and higher than the positive indicator, the overall price action is moving downward. Currently both indicators are relatively flat (below 1) and have been in a very tight movement span since early May. The stock should move in the direction of which ever indicator breaks from this tight pattern.
The stochastic oscillator K value is 89.3405 and D value is 58.6453. This is a cyclical oscillator that is highly accurate and can be used to identify overbought/oversold levels as well as pending reversals and short-term activity. I personally use anything above 80 as overbought and below 20 as oversold. When the K value is higher than the D value, the stock is trending up. When the D value is higher that the K value the stock is trending down. The K value is currently overbought, but the overall oscillator is not yet overbought. The stock could move up a little more before reversing, or it could simply reverse now. This is the third indication of potential downward movement in the near-term.
The formation of the double top is the fourth indication of potential downward movement. A double top occurred in March and the stock dropped 9.33% over 16 trading days. If this is indeed a double top, a similar drop could occur.
Considering the RSI, TSI, VI and stochastic levels, the overall direction favors a move to the downside. Based on historical movement compared to current levels and the current position, the stock could gain at least 2.60% over the next 29 trading days if not sooner.

