$MAA, Double topDangerous double top for MAA with lower highs.
The setup comes after a run of 33% and the price at 149 is gonna make a good test to check this support.
I'd bet in a new relative low to come very soon with this bearish setup.
MAA trade ideas

$MAA with a Bullish outlook following its earnings #Stocks The PEAD projected a bullish outlook for $MAA after a positive under reaction following its earnings release placing the stock in drift A with an expected accuracy of 50%.

$MAA with a Bullish outlook following its earnings #Stocks The PEAD projected a Bullish outlook for $MAA after a Negative over reaction following its earnings release placing the stock in drift C with an expected accuracy of 83.33%.

MAA - Curved Uptrend ContinuationOn this 12H chart a curved uptrend is apparent
A breakdown of this curve is very possible, but if it has one more move up left the double curve is how it will likely play out
This isn't a log chart

MAA - Bearish Continuation H&SGreen trend lines are strong up trend lines
A H&S pattern is completing itself above the trend lines
This H&S will bring price back to a strong level of support at the horizontal white line
Daily Chart

MAA: mean reversion trade?A bullish trend direction is applicable above 205.
Crossing below this level will negate the bullish stance.
Upside price momentum supports the bullish trend direction.
A price action close to the lower range of the linear regression channel pattern increases the likelihood of a mean reversion trade.
RSI leaves enough room for further upside price potential.

MAA showing strength in the Real Estate sector.* Good earnings
* Very strong up trend
* High 3-month relative strength in the Real Estate sector
* Breaking out of a base on base pattern
* The upper base was constructed over 6 weeks
* Breaking out with a lot of volume (130.2% above the 15 day average)
* The Real Estate sector has been consolidating in a very tight range for the past several weeks and is showing signs of breaking out.
Trade Idea:
* Now's a good time to enter as the price broke out for the second time in 3 days.
* It broke out with tonnes of volume so I expect $207.69 to serve as support moving forward
* Alternatively, if you're not getting in now, you can look for buying opportunities near the support of $207.69.
Caution:
* Needless to say, the market is very volatile at the moment and if this makes a daily close below the 20 EMA you might want to consider taking an early exit.

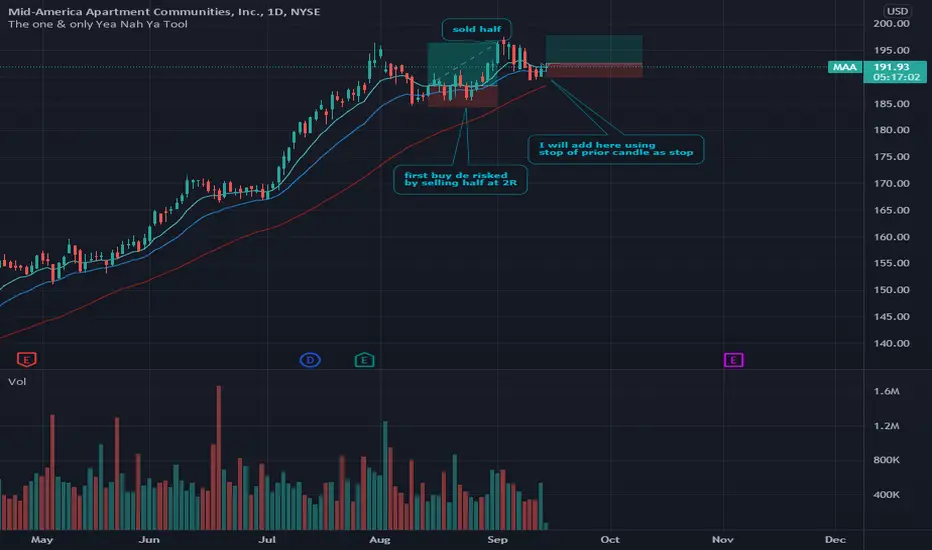
MAA, Second buy, Long Here is one of my stronger uptrends , slower mover but robust uptrend . Nice RS too .
Trying to add to position on this pop above 10ema vs prior candle low .
May be a good idea to give stop a bit more room than me and base it off the swing low instead ..
In 192.56
stop 189.86

MAA, Mid-America Apartment Communities - Trailing StopNYSE:MAA
We often read that technical analysis is foolish or that it's all bullshit and so on.
You know, at the end I started analyzing charts and graphs for months and at the end I realized that a statistic from the point of view of the realization of the trades is absolutely there.
What matters is where to position yourself, with how much to position yourself, where to go out in case things go in the opposite direction and when to bring home the profits.
I know what I'm doing because I created it, and so I already know statistically what to expect from my operations.
The only thing I always have to compare is my Backtest with my actual operation and analyze if my statistics correspond to my study of the past.
P.s. I do not consider fundamental and quantitative analysis to be wrong.

MAA: Sort opportunityAn intraday high potential, Back Tested Sort Analysis.
We ll try to enter into the correction of the uptrend movement tracking trend oscillators as below:
Price is likely to fluctuate within parallel channel's boundaries.
DETAILS ON THE CHART
NOTE: Entry range area above the entry point, is calculated upon 80% of the recorded pullback back tested past performances
DISCLAIMER: This is a technical analysis study, not an advice or recommendation to invest money on.

maa - breaking out maa has been testing that major support level for a full month now and it has held well. breaking out today and im in targeting around the $100 area.

MAA: Enguling bullish + double bottomEngulfing bullish pattern and at the same time a double bottom (even though not very nice, but still).


MAA - Possible double top short opportunity MAA appears to be forming a double top that's bouncing off of resistance from a triangle it's been forming since the middle of last year. Completion of a double top at approximately $98.00 would make a good case for shorting. For the more aggressive, you could short on a good indication that the second bounce (since early march) off resistance is complete. From there, expect a move down to $88.00
PS: I wouldn't stick around past $88.00 because this stock is bullish on the 1W.


MAA BIG TOP ONE FOR THE WATCHLISTNice top forming at Mid American Apartments - MAA - weekly - daily. Will be in my watchlist waiting for downwards move to confirmation line.

MAA - Insider BuyingReid William Sanders - Director - bought 1300 shares on 11/13/13
Robert DelPriore - Evp, General Counsel - bought 1000 shares on 11/29/13
(Both open market buys - not option exercising)
This is the first insider buying activity since 2009.
Price is at 52 week lows.
Perhaps this insider buying is signaling that the stock is undervalued at the moment.
Look for longs
