Newmont showing an extremely positive outlookSome notes which can be used as arguments to the bullish outlook:
The stock is above the 200D and even the 200W EMA.
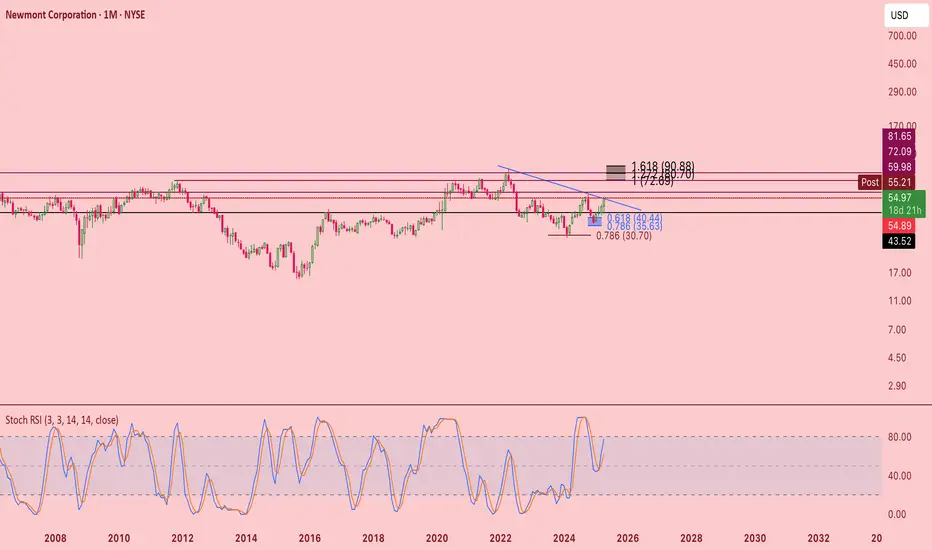
Large inverted head and shoulders structure which presents an opportunity leading up to 80$ which also turns out to be the resistance level tested in 1987 and 2022.
Locally looks like someone has been accumulating.
Gold's bullish price into price discovery, geo-political uncertainty only re-affirms the thesis.
My expectation are that by the end of this year if not by middle of next year that the 80$ price target will be reached. There is a small stop at 65$ but I am highly doubtful we will stay a lot of time there.
NEM trade ideas

NEM - Cup and Handle - to 85Classic look. Strong despite weakening gold price. As S&P continues into new high territory, time for the laggards to pick up the pace.

Newmont Corp | NEM | Long at $48.00While gold prices have soared recently, gold mining stocks have lagged. Newmont Corp NYSE:NEM , the world's largest gold mining corporation, may be undervalued if the miners take off to catch up to the gold demand/price. Currently sitting near $48.00 and at a historical moving average that it will need to break to show a true trend reversal, NYSE:NEM is in a personal buy zone. Now, the price may break down at the simple moving average and test the patience of shareholders, but the long game may benefit those who can tolerate the volatility.
Target #1 = $57.00
Target #2 = $71.00

Potential outside week and bullish potential for NEMEntry conditions:
(i) higher share price for ASX:NEM above the level of the potential outside week noted on 13th June (i.e.: above the level of $88.35).
Stop loss for the trade would be:
(i) below the low of the outside week on 11th June (i.e.: below $80.70), should the trade activate.

NEM Newmont Corporation engages in the production and exploration of gold properties. It also explores for copper, silver, zinc, lead, and other metals. average analyst rating $56.
Technically showing cup and handle and above all important MA's. it can run anytime now keep and eye.

Potential Uptrend in NewmontNewmont has been climbing this year, and some traders may see further upside in the S&P 500’s only pure-play gold miner.
The first pattern on today’s chart is the pullback since mid-April. The lower low, lower high and second lower low may be viewed as a potential A-B-C correction. Completion of such a formation may suggest a longer-term uptrend is poised to resume.
Second, the 50-day simple moving average (SMA) had a “golden cross” above the 200-day SMA in April and has remained there since. That may reflect a bullish longer-term trend.
Third, prices are back above the 50-day SMA and bounced above the 200-day SMA.
Finally, stochastics are turning up from an oversold condition.
Check out TradingView's The Leap competition sponsored by TradeStation.
TradeStation has, for decades, advanced the trading industry, providing access to stocks, options and futures. If you're born to trade, we could be for you. See our Overview for more.
Past performance, whether actual or indicated by historical tests of strategies, is no guarantee of future performance or success. There is a possibility that you may sustain a loss equal to or greater than your entire investment regardless of which asset class you trade (equities, options or futures); therefore, you should not invest or risk money that you cannot afford to lose. Online trading is not suitable for all investors. View the document titled Characteristics and Risks of Standardized Options at www.TradeStation.com . Before trading any asset class, customers must read the relevant risk disclosure statements on www.TradeStation.com . System access and trade placement and execution may be delayed or fail due to market volatility and volume, quote delays, system and software errors, Internet traffic, outages and other factors.
Securities and futures trading is offered to self-directed customers by TradeStation Securities, Inc., a broker-dealer registered with the Securities and Exchange Commission and a futures commission merchant licensed with the Commodity Futures Trading Commission). TradeStation Securities is a member of the Financial Industry Regulatory Authority, the National Futures Association, and a number of exchanges.
TradeStation Securities, Inc. and TradeStation Technologies, Inc. are each wholly owned subsidiaries of TradeStation Group, Inc., both operating, and providing products and services, under the TradeStation brand and trademark. When applying for, or purchasing, accounts, subscriptions, products and services, it is important that you know which company you will be dealing with. Visit www.TradeStation.com for further important information explaining what this means.

Newmont (NEM): Precious Metals Power Technical SetupNewmont Corporation (NEM), one of the world’s largest gold producers, remains a go-to name for investors seeking exposure to precious metals. With a diverse portfolio of global mining operations, Newmont produces not just gold but also copper, silver, and zinc—making it a key player in both the metals and commodities sectors. Its commitment to sustainability, operational efficiency, and long-term resource development continues to drive investor interest, especially during periods of inflation and economic uncertainty.
Technically, the stock is holding above the 0.236 Fibonacci retracement level, placing it firmly in the momentum zone. The price is testing recent highs, showing bullish strength and signaling the potential for a breakout if buyers continue to step in with volume. This setup reflects increasing optimism and strong positioning in the broader market for gold-related equities.

Newmont (NEM): On the Road to $100?Newmont's recent price action, combined with the strength in gold, is starting to flash a familiar pattern — one that, historically, has preceded major rallies. With gold trading firmly above $2,500/oz and Newmont delivering strong free cash flow ($1.2B in Q1), the fundamental backdrop couldn’t be more supportive. This is no longer a “cheap optionality” gold miner — it’s leaner, focused on Tier 1 assets, and finally starting to act like the cash-generating machine it is.
From a technical standpoint, the breakout above the $48–$50 resistance zone was a key moment. There's now very little historical supply between current levels and the $80–85 range, and beyond that — open air until the psychologically charged $100 level. The current setup could be interpreted as either a classic cup and handle or an inverse head and shoulders pattern. In both cases, the structure targets a move of roughly +74% from the breakout — aligning almost perfectly with what history suggests.
Zooming out, Newmont has just completed a sixth historical breakout from long-term consolidation — following similar ones in 1979, 1986, 2001, 2016, 2019, and now again in March 2025. Each of those previous breakouts was accompanied by a confirmed bullish crossover in the 3-Year Distance % from Moving Average (MA), where price momentum pushed the indicator decisively above the zero line. The five prior rallies saw NEM increase by 156%, 302%, 208%, 63%, and 112% respectively.
Given that this time the breakout comes above all-time highs, the setup feels even stronger — and the path to $100 looks not only feasible, but statistically probable. The presence of a powerful long-term base, macro tailwinds, and renewed institutional interest in gold miners all point in the same direction.
If this move plays out like previous cycles, Newmont won’t just grind higher — it could rerate entirely, especially if capital rotation flows back into large-cap gold producers. Keep in mind: this is the largest publicly traded gold miner, with a robust balance sheet and solid dividend, in an environment where gold is hitting nominal records and fiat credibility is under pressure.
📈 Watch price behavior as it approaches $80–85 — a successful retest and continuation would make the $100 target all the more compelling.
Let me know your thoughts — are institutions coming back to the gold miners, or will momentum continue favoring the smaller silver plays and explorers?

$NEM - looks ready to trendWatch the monthly candle close. If it closes above 55, i expect this one to hit 70 very soon
NEM H&SThis looks like an inverted Head and Shoulders doesn't it?
I wouldn't be surprised if this right shoulder had a double-bottom.

NEM - Big Move AheadOver the long term, I expect to see NEM at 100. My crude wave count shows that we are entering into a wave 3 that can boost shares to mid $80s.

NEM eyes on $43.06: key Resistance to break and paint a BOTTOMNEM has been lagging gold and other metals' charts.
Currently up against a key resistance to a recovery.
Break-n-retest to paint a bottom, or reject to doom.
==============================================
,

NEM // cup handle formationAlthough there is a cup handle formation image on the chart, the targets are drawn according to Fibonacci. We need closings above 48.08 as a formation condition.

CUP and Handle Pattern NEM Stock making cup and handle along with bullish divergence, expected bullish trend, trade plane has been defined along with risk and reward.

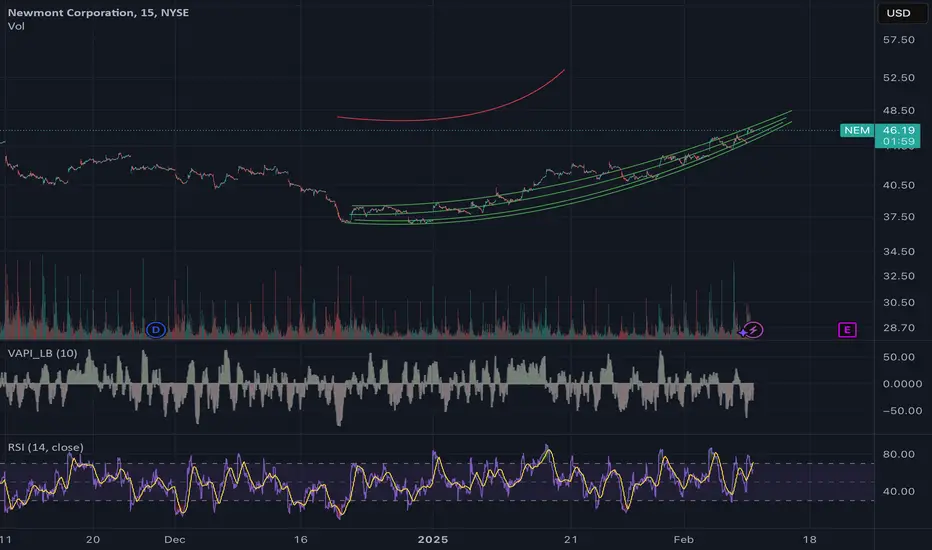
Bullish behaviour on NEM stockThe price of Newmont Corporation shares retraced to the areas where professional buying took place in the past (blue rectangles). The volume during that move down is decreasing, which, according to Volume Spread Analysis (VSA), is bullish behaviour.
Also, given that today's bar penetrates the recent demand zone and the professionals were buying there again, this stock looks very strong and has a high chance of reversal.
Closing above the $43.72 level followed by its testing on daily or lower (1H, 15 minutes) timeframes might start the rally towards $55.13 - $55.89 with resistance around $49.27 - $50.12.
If today's bar is tested and supply reappears during this process, we may expect an extension of the ongoing correction to the $37.53 - $38.37 area and another surge of buying there.

long NEMIn practice, many successful traders use these indicators as part of a broader strategy that includes backtesting, diversified signals, and strict risk controls. So, while these tools can be viable in helping to make informed decisions, they work best when integrated into a well-rounded trading system rather than relied upon in isolation.
Expected $47-$50 By Feb, 2025It broke above 50 SMA and out of the channel in the week of April 22, 2024. Made good progress but broke below the 50 SMA and further the higher low of the week June 03, 2024. It is forming a bullish megaphone. In the near term, $47 is expected by next earnings. Holding January 2026 $50 calls.

100% to ATH & huge flag and Tri target for over performanceBullish chart 100% on the table
I am tracking about 22% increase from here to gold base metal target so this is 5x of that move which seems a lot can it do that in 2025 or will we need a bit longer. I dont know, lets wait and see its a multi year chart so muli year target
Equites look over valued generally so this may be a safe haven in any bear market because it holds many tonnes of gold as per 1929-1935 when in relative terms you had price increase with dividends over 25x in bear or 50x to '35 or 74x incld divi by holding the gold mining stock at the time, plus FDR revalued the gold price. Logic is still the same it will be a bumpy ride as gold is sold to pay margin calls but overall there is a lot of money which will need to be parked. As fund mngrs see gold as a value stock because relatively to the equity index's its not going down as much.
100% back to ATH
higher flag target
higher triangle target
Gold in triangle breakout
CRB in triangle breakout (Commodities Index)

Newmont buy zone around $17Trade the range - if you have the patience. Buy under $20 and sell at $64 for 200%+ gains

NEM - Falling Wedge ABCD PatternNEM is formed a falling wedge from recent highs and currently making falling wedge with ABCD pattern. This means there is one more leg downwards to go. In ABCD pattern, the size of the second move downwards is very much the same as first move (either in $ or % terms). The projected price of completion of this falling wedge with ABCD pattern is between 30.22 and 20.50 because this coincides with:
- a number of trendlines and major support zone from Weekly timeframe meet around 30.22 and 29.50 (point D)
- gap fill is also at 29.87
Also, if we look at price range of first wedge pattern drop, it was about 31% (from point A to B). With the formation of ABCD, the second wedge pattern price drop is also likely to be about 31% from point C to D of ABCD pattern.

$NEM with a bullish outlook following its earnings #StocksThe PEAD projected a bullish outlook for NYSE:NEM after a negative under reaction following its earnings release placing the stock in drift D with an expected accuracy of 86.67%.

$NEMGreen: Entry Point
Blue: Start of Week
Red: End of Week
Thumbs Up: Trade Available for Week
Numbers: Price Targets
*For share traders only. Not meant for options.

A mining company with hopeSince Gold is dragging every major mining company down this one can be a decent buy in case of a pullback to support, after that i guess it can climb higher assuming if mining stocks gonna stay in good shape
