$NET Analysis, Key Levels & TargetsNYSE:NET Analysis, Key Levels & Targets
Request analysis for @f7rt7fmhzz
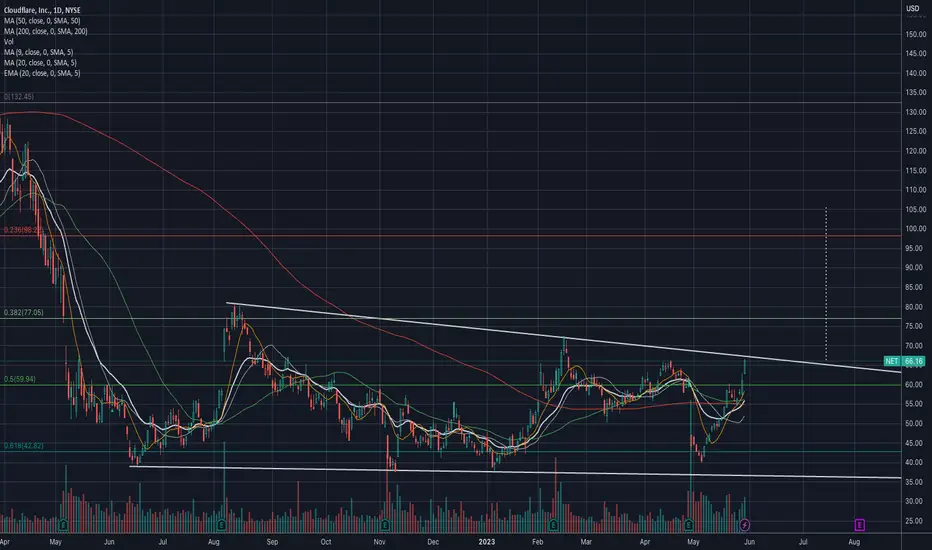
NET is at a very interesting resistance level at 68.83… I would watch this level closely… A break above that would be an early buy signal (on the BIG timeframes) and then I’d be looking for some follow through (volume, and if it does pull back I’d be wanting to see that it holds above the Daily 200MA for a long term hold… (currently 54.73)
Support on the Daily timeframe needs to hold 59.21
Overall it looks like it has had a solid correction and it still doesn’t have all of the buy signals but might be a good place for accumulation… and it looks like it could be heading into clearer chart territory by the end of the year….
And MacD on the weekly is looking like it’s trying to break up into the long side…. Keep an eye on that too…
We definitely could see lower, and in this market you just don't know, but this does appear to be a good entry, especially if you're thinking of long term...
I’ll set some alerts and do a little more research on this company… 💃🏻 hope this helps…
NET trade ideas

Cloudflare (NET): In low risk / high reward territory (buy) Cloudflare has strong fundamentals and was recently oversold to nearly the lower 200 day 2nd standard deviation.
A reversion to the 200 day mean yields 30% (my estimate: over the next 1-2 months).
A visit to the all-time-high would be 420% (my estimate: over the next 2 years).
A recession may force it lower, however.

$NET - Triangle break out watchNYSE:NET #Cloudflare is one of AI beneficiaries. Currently up against the upper trend line resistance. RSI is nearing over bought. Upside targets - $77, $100. Down side risk - $55 - $51
NET , TP 54.65, SHORT TF = H1On the hourly chart, the trend started on May 19 (linear regression channel).
There is a high probability of profit. Possible take profit level is 54.65
But do not forget about SL = 60.23
Good luck!
Regards, WeBelieveInTrading

NET SHORTStay tuned to see how Cloudflare's revenue continues to grow in a predictable fashion! We're confident that the company has a compelling value proposition and will soon become profitable. It's an exciting time for investors who are willing to take on their own risk.
#Cloudflare NYSE:NET

Technical Analysis Of Cloudflare Inc (NET)As Cloudflare Inc is in last leg of selling. My advice would be accumulate at this levels for the short term and as well as long term. My Strategy would be invest in the time horizon for 4-5 Years.

NET back to trendlinesNET is just one of those stocks, when it wants to move, it can move quick. Has already retraced to the previous breakout and is at the daily 50, and multiple ascending trendlines.

no trigger no trade 💯NET above trend resistance/66.5 long scalps can work, above 83 and we can see bigger rally to 100-200+
Boost and follow for more! 💛


Decision zoneThis is in quite the tight spot. At the daily 200MA, descending trend line right above. Price is wedged right between a point where it could really bounce quickly for a nice move or it fades lower.
$NET | Cloudflare Finds Buyers at $40 LevelCloudflare has held firmly above the $40 demand zone.
If price can hold above $37 I expect upside to at least $50.
Invalidation below 37

NET: My Last Trade & the Next One: Patience & RenkoI just posted a note on the power of using Renko charts in preparing for a position - linked to this one.
NET (Cloudflare) is on my watchlist for new positions. Had a quick trade on NET around the earnings earlier this month - and i'm now watching the chart for the next trade. would like to share some details showing another example of the power of Renko charts
- entry @ $59 on the 8th - as marked on the chart
- exited @ $69.45 -- triggered by a 3% trailing stop on the gap down on 16th .. P&L% was 17.7% -- not bad for a 1 week position (my P&L% was a bit higher as i also sold a weekly covered call as an earnings play)
(Note: yellow vertical line shows where my entry would have been if I entered based on the chart signals - but i entered ahead of the earnings on strong fundamentals and expecting strong earnings.. the earning day's action confirmed the position was at little risk)
so now, i'm looking for my next entry to ride the next leg up - believing that NET is starting what might be a strong trend as the market recovers - and the most important tools to help me pinpoint my next entry are: patience and Renko. here's how:
- we can see 3 "FOMO Traps" in 3 consecutive days .. where NET opens with a gap (up or down) then runs up fast, only to close lower than open, trapping traders who thought that "this is it! the move up started .. let me in" - or those who have tight BUY STOP orders
- these FOMO Traps don't even show on the Renko - and the Renko chart clearly shows that we're still "not there yet"
- the MACD and the Strength Inspector on the Renko are both far from a positive setup. the MA's are still heading down .. clearly NET still needs to "build up" a bit more before the next leg up;
- The entry setup i'm waiting for has been specified - My Alerts are set .. and the "Fisherman patience" mode is on :) .. waiting for the next ride.
(As usual: This is not a trade recommendation !! but i hope it helps provide couple of good trade analysis nuggets :))

NETNET – some observation
Since reaching a low of around $40 early this year, stock has been rebounding. Tested the $40 level couple of times. That level is likely to act as a strong support.
Additionally, since its IPO (2019) to Dec 2021, the weekly RSI remained above 50 (highlighted); prices generally moved higher during this period.
In Dec 2021, RSI dipped below 50 and remained under that level in 2022, prices moved lower.
In 2023, weekly RSI is back above 50 and if it continues to stay above that level, prices should generally be higher

$NET targeting the low $20 rangeThere seems to be one more low coming for $NET. Upon a breakdown of the descending triangle and support at $38, we'd likely see a quick move down targeting the low $20 range.
Let's see how it plays out over the coming weeks.

Cloudflare continues in a trend of lower highs.Cloudflare - 30d expiry - We look to Sell at 52.98 (stop at 56.11)
Our short term bias remains negative.
Daily signals are bearish.
The medium term focus remains bearish and intraday rallies continue to find sellers.
The trend of lower highs is located at 54.00.
We look for a temporary move higher.
Preferred trade is to sell into rallies.
Levels close to the 38.2% pullback level of 54 found sellers.
Our profit targets will be 45.15 and 44.15
Resistance: 47.00 / 51.00 / 54.00
Support: 43.00 / 41.32 / 37.37
Disclaimer – Saxo Bank Group.
Please be reminded – you alone are responsible for your trading – both gains and losses. There is a very high degree of risk involved in trading. The technical analysis , like any and all indicators, strategies, columns, articles and other features accessible on/though this site (including those from Signal Centre) are for informational purposes only and should not be construed as investment advice by you. Such technical analysis are believed to be obtained from sources believed to be reliable, but not warrant their respective completeness or accuracy, or warrant any results from the use of the information. Your use of the technical analysis , as would also your use of any and all mentioned indicators, strategies, columns, articles and all other features, is entirely at your own risk and it is your sole responsibility to evaluate the accuracy, completeness and usefulness (including suitability) of the information. You should assess the risk of any trade with your financial adviser and make your own independent decision(s) regarding any tradable products which may be the subject matter of the technical analysis or any of the said indicators, strategies, columns, articles and all other features.
Please also be reminded that if despite the above, any of the said technical analysis (or any of the said indicators, strategies, columns, articles and other features accessible on/through this site) is found to be advisory or a recommendation; and not merely informational in nature, the same is in any event provided with the intention of being for general circulation and availability only. As such it is not intended to and does not form part of any offer or recommendation directed at you specifically, or have any regard to the investment objectives, financial situation or needs of yourself or any other specific person. Before committing to a trade or investment therefore, please seek advice from a financial or other professional adviser regarding the suitability of the product for you and (where available) read the relevant product offer/description documents, including the risk disclosures. If you do not wish to seek such financial advice, please still exercise your mind and consider carefully whether the product is suitable for you because you alone remain responsible for your trading – both gains and losses.

Possible bullish breakout for NETThe bullish divergence is confirmed and there is a high chance for a breakout.
Wait for a strong green candle breaking the trend line.
TP1: $64.92 (33.2% profit)
TP2: $74.98 (53.9% profit)
TP3: $80.32 (64.9% profit)
SL: $39.86 (18.2% loss)

NET weekly at despair zone of the bubble cycle market entry HODLTake profit $221.72
NET weekly at despair zone of the bubble cycle market entry HODL stop loss $0

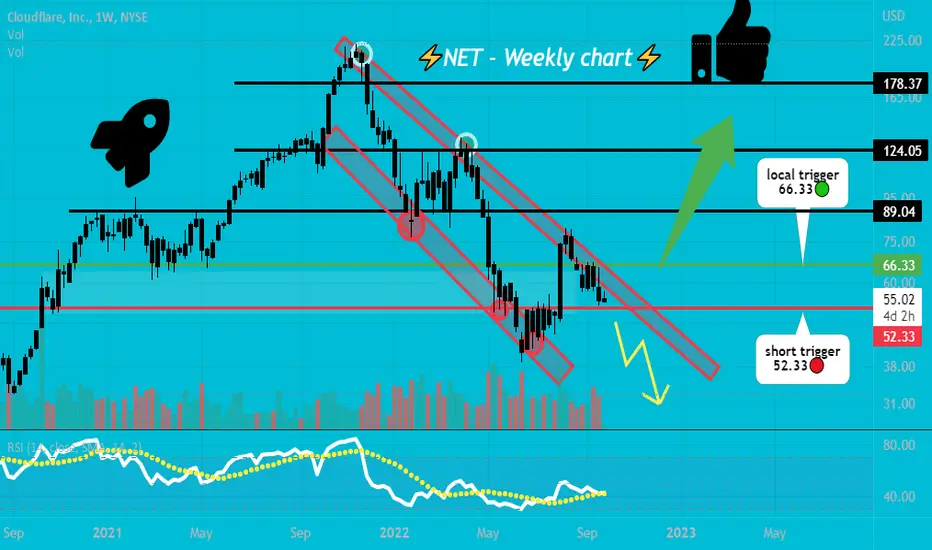
NET clearly still in bearish downtrend 💯bearish bias is logical until 66.33/trend resistance is broken, watching for break of 52.33 for more downside
NET: Fell right back in the channelNET broke out of the ascending channel in August and fell right back in as soon as September hit. Interesting to see where this one will go. No position.

$NET in Bull flag channel $NET in Bull Flag channel, bounced off bottom line , with divergence in the Stochastic.

nice break through trigger level 🥝#NET $NET nice break through trigger level 🥝
broke through long trigger/extreme trend resistance all in one move! amazing.
now struggling with RSI resistance though, once we cross that I expect a rally to 89.04-124.05-178.37

NET - Breakaway Gap (huge volume!)NET gap out of a right angle triangle with extremely huge volume. This is likely to be a "breakaway gap" which usually occurs at the beginning of a trend and the odds of this gap closing in the near future is slim.
There is a near term possible resistance coming up (filling of a prior gap) at around 77-78. Any dips going forward should be opportunity to long as there is room on the upside.
Disclaimer: Just my 2 cents and not a trade advice. Kindly do your own due diligence and trade according to your own risk tolerance and don't forget that money management is important! Take care and Good Luck!

NETI have been seeing this in a few sectors, but I see a Wyckoff Distribution (#2) occurring here as well. There is a gap at around $50 that I'm expecting it to fill.
1Y
RSI is topping.
MFI is overextending.
5Y
RSI is rising.
MFI is trending up.
ALL
RSI is showing a short incline, but could be peaking at 20 for a drop down after.
MFI is in a decline.
Volume also looks to be trending lower with lower highs.
The indicators could give a case for going higher with some of them being bullish.
Prediction: I believe we will see this fall.
For my educational purpose, not to be used as financial advice.
