7/3/25 - NOAH: new SELL mechanical trading signal.7/3/25 - NOAH: new SELL signal chosen by a rules based, mechanical trading system.
NOAH - SELL SHORT
Stop Loss @ 12.59
Entry SELL SHORT @ 11.25
Target Profit @ 9.13
Analysis:
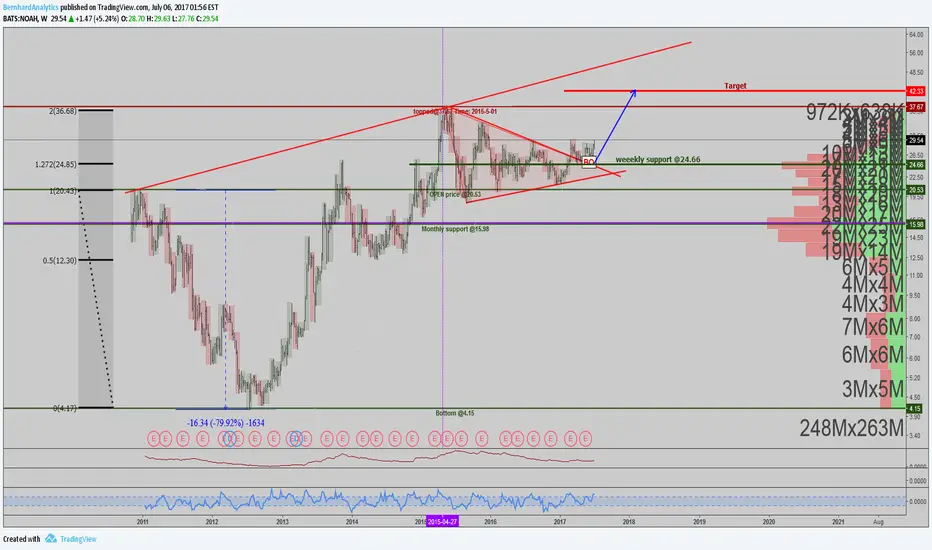
Higher timeframe: Prices have stayed below the upper channel line of the ATR (Average True Range) Keltner Channel and reversed.
Higher timeframe: Victor Sperandeo's (Trader Vic) classic 1-2-3/2B SELL pattern...where the current highest top breakout price is less or only slightly peaking higher than the preceding top price.
NOAH trade ideas

NOAH: Potential chartNOAH: Potential chart
-Quasimodo pattern.
-Demand volume and candled has confirmed.
.
Let's jump and ẹnjoy!
US STOCKS- WALL STREET DREAM- LET'S THE MARKET SPEAK!

NOAH Holdings Limited Options Ahead Of EarningsLooking at the NOAH Holdings Limited options chain ahead of earnings , i would buy the $30 strike price Calls with
2023-3-17 expiration date for about
$0.35 premium.
If the options turn out to be profitable Before the earnings release, i would sell at least 50%.
Looking forward to read your opinion about it.

Noah Holdings Limited Announces US$100 Million Share Repurchase NOAH: Noah Holdings Limited
2020-11-30 16:05:00
Noah Holdings Limited Announces US$100 Million Share Repurchase Program

Noah holdings 120%+ potentialNoah Holdings has reached a floor and it could lead to a bullish trend. My target sits on $72.00 to $76.00. Long term investment ( over 365 days).
I use this app to track my investments not to provide advise, trade at your own risk.

NOAH: Chinese economic conditions support this.Spent way too much time studying this company and don't find any negative and top of that current economic situation in China actually supports this business positively. Based on my studies, I opened a position in this and hoping it pays out. I have done my part and this is the best I can do.
One giant cup formation, way above Ichimoku Cloud, RSI is not crazily over bought. Get set and go. Earning is due on March 5th (I think).
I have this:
NOAH Apr 18th -- 65 calls

$NOAH - Skraight slippageCame up on my intra-day linear regression scanner (> .4 Linear regression + down > -10% past 20 days). Linear regression less than .4 basically represents a straight line during past 8 trading days (could be either direction) - basically meaning, small or large impulse move in opposite direction is pretty necessary lol. Just based off the placement of both 20 & 45 EMA, something was up. Most (buyable) dips come with a cross-below 55 (low) MA. 20 & 45 EMA tend to cross below at a time close enough together to the point you don't see a gap between all 3 (where yellow is below white, green is above white) - I saw this with $CMD. Lost a kidney with that one trying to BTD, surprisingly, the pattern alignment is pretty straight forward except for the downfall. Still pretty early in the down-trend though, so it's tough to give a more clear cut direction based on only the moving averages. Will definitely have to check back after the impulse move runs its course (although, may / may not be much of a move at all). Original up-trend was one of my favorites - "KAATTTIEEEE" lol. Typically occurs right before the start of one last hell of a fucking bull run, but maybe 70% of the time marks an end to it. Few differences, few similarities, but overall same general idea as my $ABBV post. Just a comparison of what a potential (temporary) move back up would be like if chart is in fact correct.

NOAH at a BUYPlaying Trading Simulator Game:
Got this BUY from Barchart's "Chart of the day".
On 5JAN18, MACD gave a buy signal.
On 10JAN18, rises above pivot point.
On 10JAN18, RSI climbing and hit 70.

NOAH HOLDINGS PLC SHORT TERM SHORT, SEEKING LONGFUNDAMENTALS/FINANCIALS
Analysing the financials of this company, it is clear their assets are growing year on year between 10-30% and there revenues are also increasing. They seek to open branches in Canada, Australia and other discussed locations. As an asset management company, it is vital to ensure profits or "Revenues" are increasing whilst assets under management "AUM" also increase. China are currently seeking to invest outside of China as there are some restrictions. Chinese high net worth individuals are on the rise more than any other country in the world, this provides business for Chinese asset managers which also operate outside of China. NOAH HOLDINGS being listed on the new York stock exchange allow a further expansion over seas. NOAH HOLDINGS market cap is currently at US$1.78 billion with a P/E ratio of 20.28, which gives the Holding an estimated market value of US$36 billion. NOAH HOLDINGS also completed a repurchase programme of US$50 million, this demonstrates the commitment to it investors and potential growth in revenues and sales profits, it is also a possible sign of strength and shareholders optimism. Based on financial analysis, the fair share price is around US$28.00 per share, currently trading at a premium. If price does breach below this level I personally believe US$24.50 a share is a key holding level. To summarise, the financials and fundamentals around this company and the industry, economic standpoint is all very bullish. The company is healthy.
TECHNICALS/PRICE ACTION
As analysed on the chart, we have strong resistance around US$33.00 per share, we have a bearish harmonic formation with price bouncing on the upper channel line. An "ABCD" formation has been completed at the 1.318 extension level. The stochastic demonstrates overbought (in line with the financial analysis of price trading at a premium). There are multiple scenarios. However, my main position will be to enter long around US$28.50-US$27.00 per share (on Bullish PA confirmation), if price breaks below the channel and key holding level of US$25.00 per share then I will be out of this trade. However, as it stands from US$28.00 my target will be US$35.00 to US$40.00, possibly higher.
***PLEASE BE AWARE THIS IS JUST AN IDEA, IT IS NOT MY ACTUAL TRADE, I SEEK ENTRY AROUND THESE LEVELS IF PRICE DOES DEMONSTRATE BULLISH PA, THEN I WILL BE EXECUTING THIS TRADE. TRADE AT OWN RISK.***

TRIANGLE BROKE, IT'S A LONG, 90% SURE ABOUT THIS SET UP TRIANGLE BROKE, IT'S A LONG, 90% SURE ABOUT THIS SET UP

Noah Holdings -- Diamond Bottom -- 6 to 20 week BreakoutNOAH forms “Diamond Bottom” pattern
Description
Bottom Triangles and Bottom Wedges make up a group of patterns which have the same general shape as Symmetrical Triangles, Wedges, Ascending Triangles and Descending Triangles. The difference is that these particular formations are reversal and not continuation patterns. These patterns have two converging trendlines. The pattern will display two highs touching the upper trendline and two lows touching the lower trendline. Contrary to Triangle formations, Wedges are characterized by their boundary trendlines both moving in the same direction.
Volume is an important factor to consider. Typically, volume follows a reliable pattern: volume should diminish as the price swings back and forth between an increasingly narrow range of highs and lows. However, when the breakout occurs, there should be a noticeable increase in volume. If this volume picture is not clear, investors should be cautious about decisions based on the particular Triangle or Wedge pattern.
This pattern is confirmed when the price breaks upward out of the Bottom Triangle or Bottom Wedge formation to close above the upper trendline.
Important Characteristics
Following are important characteristics for this pattern.
Occurrence of a Breakout
Technical analysts pay close attention to how long the pattern takes to develop to its apex. The general rule is that prices should break out - clearly penetrate the upper trendline - somewhere between three-quarters and two-thirds of the horizontal width of the formation. The break out, in other words, should occur well before the pattern reaches the apex of the Triangle or Wedge. The closer the breakout occurs to the apex the less reliable the formation.
Duration of the Triangle or Wedge
This pattern is a relatively short-term. While long-term Bottom Triangles and Bottom Wedges do form, the most reliable patterns take between one and three months to form.
Volume
Investors should see volume decreasing as the pattern progresses toward the apex of the triangular or wedge shaped pattern. At breakout, however, there should be a noticeable increase in volume.
Optionable Stock
The stock's price has broken upward to confirm a classic chart pattern, offering a target price for the intermediate-term in the range of 31.25 to 32.50.
Earnings Per Share (EPS) was up 16% compared to the same quarter in the prior year, and has grown an average of 21% annually over the past 5 years. This tells us the company increased earnings and/or decreased the number of shares.
Return on Equity (ROE) is 26% for the latest twelve months. This reflects how efficient the company has been at turning a profit on the money shareholders have invested.
With a market cap of 1.47B, this is considered a small cap stock which offers the potential for above average returns, though in exchange for greater risk and volatility.
Support found at: $24.20
Resistance found at: $25.18


$noah at resistance$NOAH plunged to the 200dma on Tuesday but caught support. On Wednesday it maintained support and today it proceeded to gap up on heavy volume. For fans of the “Right or Right Out” (RORO) trade, $NOAH offered it vs the $21 level (both Tuesday and Wednesday’s low of day). The reason this was a good RORO trade was because of the following:
-Shakeout below major support (200dma) And recovery
-Support established consistently (back to back days at $21)
-Day two (in this case Wednesday) showed support by closing in the middle of its range
-Small distance between entry and exit (if entering at close do day Tuesday at $22.22 vs $21 exit)
Today $NOAH reversed, closing at the low of its trading range. It found resistance at the 10ema. For those in the RORO trade, today would have been a good day to lock in profits. For those letting it ride, they’d want to see today’s low of day at 24.70 hold.

NOAHI've never looked at this chart before. Beautiful Cup and Handle - there could be a little more upside here.

NOAH - breaks out - can it stay above 20?NOAH is very volatile - stop loss at 60, small position size
-> winners know how much they can lose
