NYSE COMPOSITE INDEX. BACK TO 20 000 MARK — KEY RESISTANCE LINEThe NYSE Composite TVC:NYA is a stock market index, that covering all common stock listed on the New York Stock Exchange, including American depositary receipts, real estate investment trusts, tracking stocks, and foreign listings.
Over 2,000 stocks are covered in the index, of which over 1,600 a
Related indices
2025 forecast NYA Wave B top nearing 20% decline plusThe chart posted is that of the NYA .12/8 /2024 Major wave B top forming target 20,190 alt 22130 . Cycles are bearish into 2025 and well into oct 2026 Depression Like decline . into oct 2026 . First big decline should take us down into the spiral turn date 3/10 2025 week . in what should be

NYA THE ONLY BULLISH WAVE COUNT 4th WAVE TRIANGLE on NEWSThe chart posted is that of the NYSE NYA this is the only Elliot wave Structure that is BULLISH I have now moved into calls in the SPY 540 and QQQ calls 450 dec 2026 . This is a HIGH RISK TRADE BUT I AM WILLING TO TAKE A 25 % position the sp cash was at 5415and qqq were at BEST at 452 put call

Multiple markets3.17.35 one of the oil companies is probably moving higher. coffee is probably moving higher. Futures oil is not clear to move a little higher or lower to decide on the direction. the Russell looks like it may be going higher.... there are a few other markets that are mentioned. gold is very bu

A review of the market1.16.25 I decided to talk about clutter and then need to keep the charts clean and accurate. it's important to take off lines that have no utility to you because that opportunity came and it went..... keep the chart from getting cluttered.... get rid of the lines that have no utility. I started wit

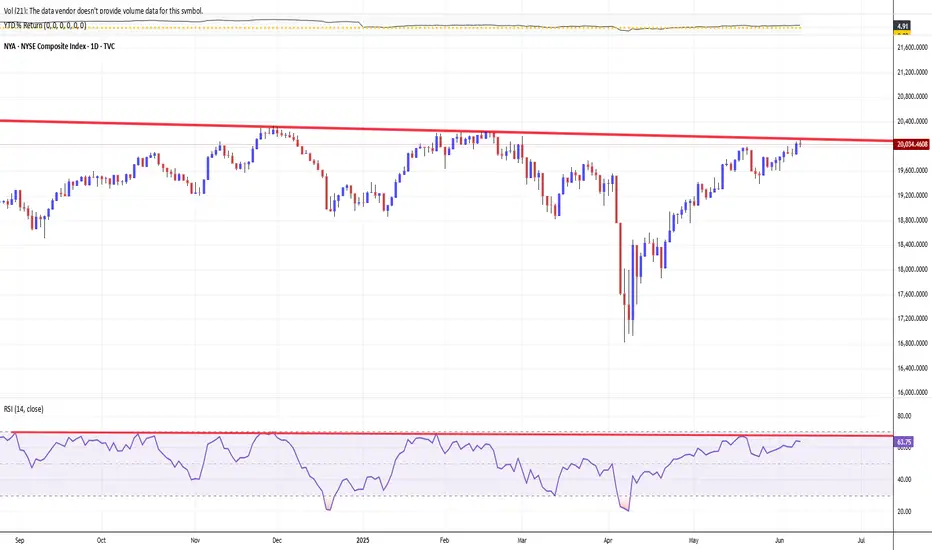
NYA (XLV, XLF,XLE, DJT,IWM)It's been a while since I've covered Cyclicals.. since we are heading into earnings next week let's kick it off.
Monthly chart here on NYA looks like we've topped a 15yr wedge after the Trump election Squeeze..
Weekly chart is showing price is holding secondary trendline (Yellow). But it's stuck

NYSE Market Correction? Repeat 2022?Do you think 2025 could see similar price action like that of 2022?
Market seems to be hitting a key resistance level when looking at the weekly charts going back to around 2007-2008.
RSI seems to be at similar levels..

NYA one of the longest decline on record 11 days march 1929 Nya has two wave counts the Bullish one first we have just finished an ABC decline and w small new high will be seen over the next 6 to 11 Td . The bearish count is a simple one we would rally for 5 to 7 td and rally back to a .50 .618 .786 max in a clear ABC to mark wave 2 up

NYSE Advance - Decline line raises concerns as it standsChart pretty self explanatory. The NYSE A/D line has NOT confirmed the recent closing highs and a concern for more upside gains after the Trump rally.

MAJOR MULTI YEAR TOP FORMING NYA The chart posted is that of the NYA index .I have Not changed my Labeling or the Spirals . The Math is and has been rather Clear over the last 10 years and in fact going into the target low of 2009 march 9th . We have now entered the MIN target for wave C up or wave 3 of 5 of 5 at 19564 The

See all ideas
Summarizing what the indicators are suggesting.
Oscillators
Neutral
SellBuy
Strong sellStrong buy
Strong sellSellNeutralBuyStrong buy
Oscillators
Neutral
SellBuy
Strong sellStrong buy
Strong sellSellNeutralBuyStrong buy
Summary
Neutral
SellBuy
Strong sellStrong buy
Strong sellSellNeutralBuyStrong buy
Summary
Neutral
SellBuy
Strong sellStrong buy
Strong sellSellNeutralBuyStrong buy
Summary
Neutral
SellBuy
Strong sellStrong buy
Strong sellSellNeutralBuyStrong buy
Moving Averages
Neutral
SellBuy
Strong sellStrong buy
Strong sellSellNeutralBuyStrong buy
Moving Averages
Neutral
SellBuy
Strong sellStrong buy
Strong sellSellNeutralBuyStrong buy
Displays a symbol's price movements over previous years to identify recurring trends.
Frequently Asked Questions
The current value of NYSE Composite Index is 20,545.60 USD — it has fallen by −0.87% in the past 24 hours. Track the index more closely on the NYSE Composite Index chart.
NYSE Composite Index value has increased by 1.02% in the past week, since last month it has shown a 3.33% increase, and over the year it's increased by 13.56%. Keep track of all changes on the NYSE Composite Index chart.
NYSE Composite Index is just a number that lets you track performance of the instruments comprising the index, so you can't invest in it directly. But you can buy NYSE Composite Index futures or funds or invest in its components.