ORI Might Move Up SoonI feel like ORI could make a move soon. It bounced from the support area around 35.9 and closed above it with good trading volume. If the momentum continues, we might see it push toward 37 or even 38.
• Target: 37 – 38
• Stop Loss: below 35.5
ORI trade ideas

What a great short opportunity! Hi everyone, Yurii Domaranskyi here. Let's take a look at the chart:
1. Price levels are working good here
2. Globally uptrend and locally range
3. the levels confirmed by many false breakouts
4. approached with small bars
5. there is accumulation under the level
6. it is an all-time high
7. enough room for a move 1 to 5.1 risk/reward
8. no news for the last 10 days
9. no ascending lows
10. the price came from above
11. no report in the following 2 weeks
Potential risk/reward ratio = 1 to 5.1 meaning that potential risk 100$ with the possibility to make 510$
If it does make sense to you, press a thumb up! 👍

The Price of OLD REPUBLIC INTERNATIONAL CORP DailyHey guys, OLD REPUBLIC INTERNATIONAL is in a bullish push with some past volume return. Looking at the TIMEFRAME M1 we observed a short hammer candle and a fake return of sales volume issued possibility of pull back. There is a great chance of breaking the price with the momentum and then at the same time reaching the following high. See the rise on the next high point of the ascending triangle with the required attempt from the highest of the bollinger to come and check the neckline.
And start again on its support after this bullish acceleration and start on the top of the bullish channel.
Please LIKE & FOLLOW, thank you!

$ORI posting positive Earnings but outlook stays Neutral$ORI posted better than expected results, but the PEAD projection kept a neutral outlook for the stock, as price is currently trading just below the median line.

ORI busted on the last tick damitWrite sometning about your psyhology thinking before trade? psyhology is ok, I am back from illness in fulliness
Describe the trade. What you see? price will go down to the level I set
What have I done well for this trade? almost everthing was perfect, enter point and set stop loss and target
What can I take away to help with later trades? that you should make stop loss a little bit more loosy


ORI- Month Charts, Do You Care?Positive's of longer time frame charts:
1) Big picture, not smaller noisy picture
2) Cypher pattern
3) Major Support and Resistance areas
4) Easy to see direction, you should be trading (bearish, bullish or sideways)
5) Easy to spot trends
From noted chart:
1) 2017 has went up/down $1.00 ($21-$20)
2) Price action is at a major resistance area
3) Bearish trading direction is showing on chart
4) Trading on shorter charts bearish
5) Consider doing put option trades
6) $17.00 is next lower support, should be hit this year
*If you are considering a bearish or selling shares of this stock and conservative trader, you could wait for closing candlestick below BB indicator 20ma.


SAMPLE OF SHOULDER-HEAD-SHOULDER AND DOUBLE TOP PATTERNSSHOWING SHOULDER-HEAD-SHOULDER AND DOUBLE TOP PATTERNS...


ORI - Bear flag formation ORI forming a nice bear flag, and now rising within a small upward channel. If it breaks down the channel, it may confirm the flag formation to the down side. We are watching it closely
You can check our detailed analysis on ORI in the trading room/ Executive summary link here-
www.youtube.com
Time Span: 7:30 "
Trade Status: Pending

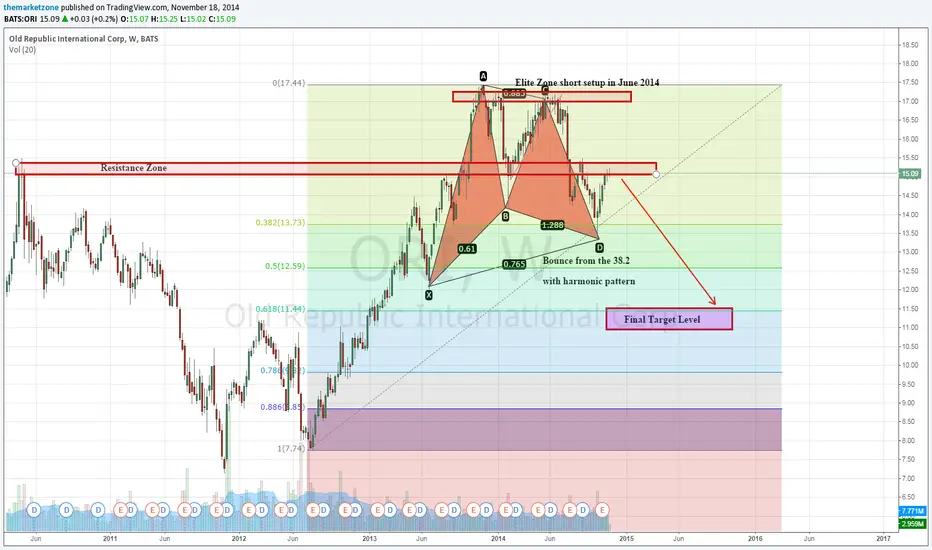
This stock maybe heading for a rough fall $ORI was traded by the Elite Zone members to the short side, back than in June. It broke a trend line we've been monitoring and created a very nice weekly double top setup.
Since than, the stock touched the 38.2 Fib level, bounced from it after the completion of a bullish Gartley and now it is facing a serious resistance zone.
If you'll analyze the daily chart you'll see a daily Wedge that can be broken if the price will reach below 15$.
My final target level, according to the analysis, is 11$ and that's the potential max reward.
a close above 15.5, may lead to a deeper pullback
Check it out..