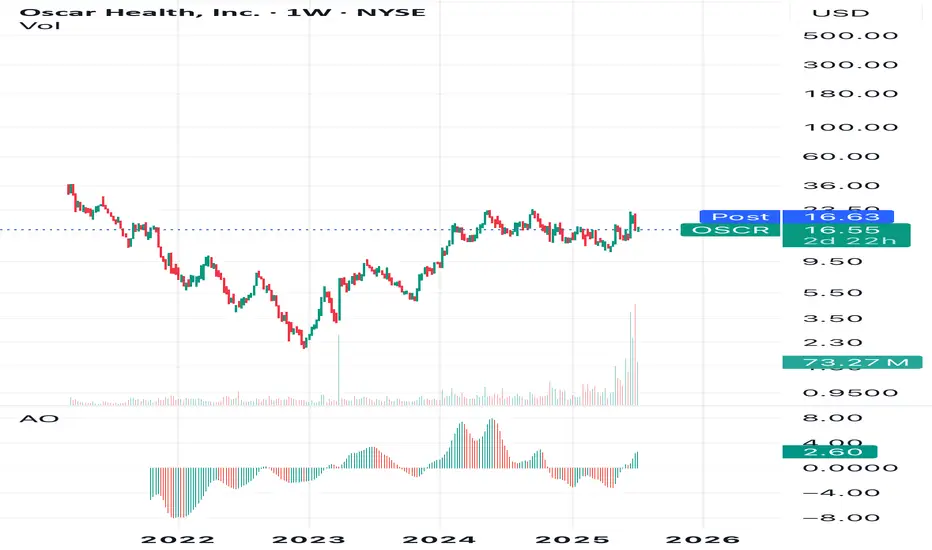
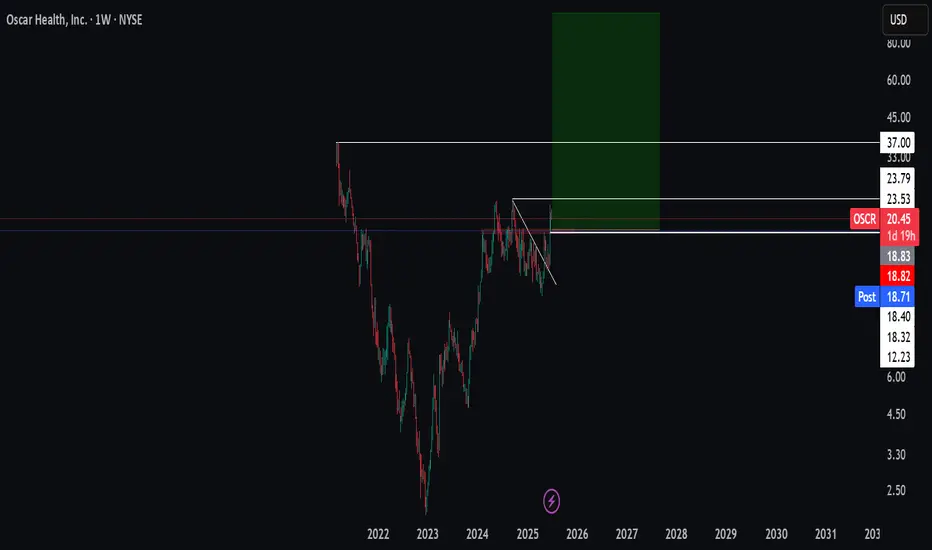
Oscar - Still bullish?Healthcare is under immense pressure, time to review the charts of the best names to own in possibly the mosted hated sector. Today I will look at Oscar Health. It's clear the trend remains down, but does this present an opportunity? Let's look at reasons to start a dca approach at key support levels:
- 43% drop from recent highs
- support coming in from the VAL
- support levels below include the golden pocket and daily support
- cup and handle formation
This could well present an opportunity for anyone who is particularly bullish on the fundamentals of this business. However, I must stress, if the critical support level is lost around $10 i'd be looking to cut my losses. Personally I will only be looking to add if we can find a base or have a reaction to the upside. Watch this closely, this stock has potential.
Not financial advice.
OSCR trade ideas

OSCR will pumpOSCR was heavily shorted this past week despite growing fundamentals. The market seems split on the stock. I see heavy growth of baseline revenue, and operating cash flow turning positive. If the company makes 15 billion in revenue in 2023 with a 6% margin that will be 900 million in earnings. This would equate to a 30 billion dollar market cap with a similar multiple. If ICHRA can expand the way the CEO predicts, an untapped 100 billion dollar market awaits. Since Oscar has utilized Ai as they built the platform, their Margins should be higher than traditional insurance companies, they will be more efficient.
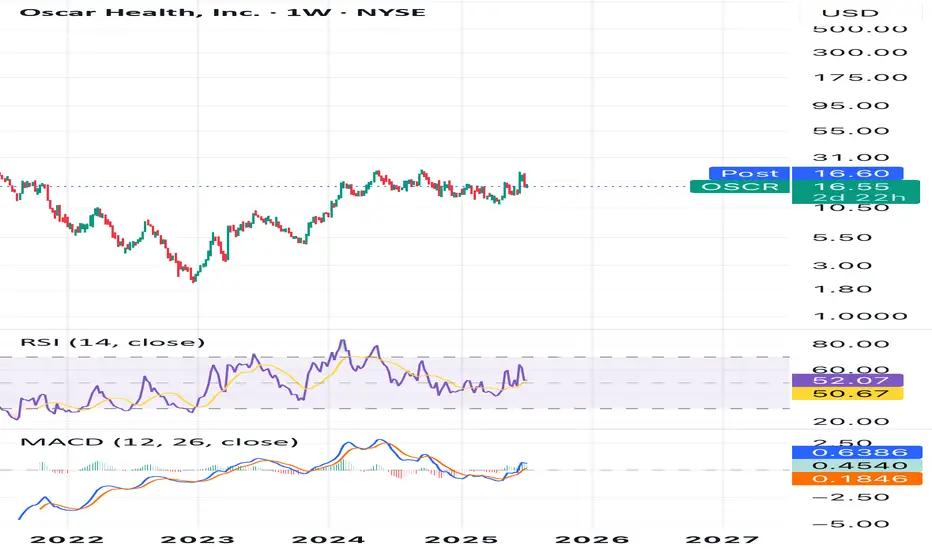
TA wise: I see a massive volume swell, resetting stochastic, and a cooling BBWP.
I will see covered calls around 16=18$ again and offload some LEAPs if we get another huge pump.
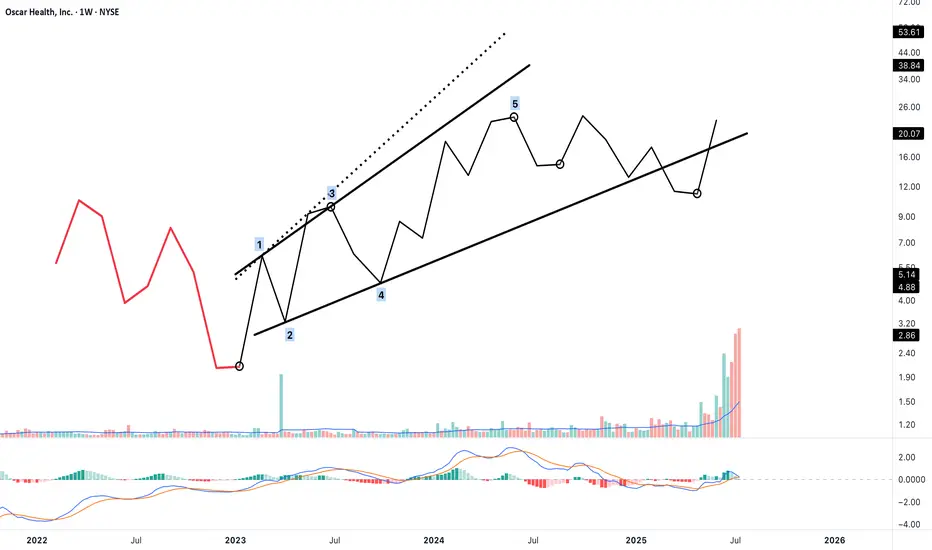
Possible Terminal Impulse as Wave 1 or A — Structure Completion?This chart presents a potential 5-wave terminal impulse structure — most likely a 5-extension terminal, where waves 1, 3, and 5 display impulsive character.
This move may represent the beginning of a new sequence — either as:
"Wave 1 of a larger motive structure"
"or Wave A of a corrective formation"
🔹 The wave is segmented using 12-bar intervals on a weekly chart.
🔹 Wave 3 and Wave 5 both meet the price extension and structural criteria of Neely’s Rule 4.
🔹 The final wave (5) reaches just above 141.4% of Wave 3, consistent with a 5-extension terminal.
🔹 Channel boundaries and post-terminal retracement suggest a completed structure.
According to NeoWave guidelines, the structure meets both:
Impulsive appearance, and
Overlap conditions required for a terminal.
The current focus shifts to analysing the post-terminal movement to determine whether it is part of a:
"2nd wave correction (if terminal was Wave 1)"
"or B wave retracement (if terminal was Wave A)"
🔍 Further bar-by-bar and structural analysis will be applied to this segment next, likely starting from m10 and beyond.
Oscar will go down to 10$ in next 3-4 months timeRecent Stock Pressure
Weak Q2 guidance from Centene weighed on sentiment, dragging OSCR down ~14%
.
Wells Fargo downgraded it to underweight, citing rising medical costs and pricing pressures in 2025
.
📊 Key Drivers for OSCR
1. 🩺 Healthcare Reform & the ACA / Medicare Advantage
Trump’s tariffs are targeted at pharma, not insurers. But if drug prices rise, costs trickle down to insurers like Oscar.
Conversely, Trump victories are seen as favorable for Medicare Advantage, potentially benefitting OSCR under a pro-Medicare Advantage regime
2. 💡 Growth & Momentum
Oscar recently posted strong Q1 results — 42% revenue growth and 45% share rally
The stock has explored the “meme stock”-like territory with ~52% weekly jump in June
🔍 What Trump Tariffs Mean for OSCR
No direct impact, as tariffs aim at imported drugs, not insurance firms.
Indirectly:
Higher drug costs → could pressure OSCR’s medical loss ratios
Meanwhile, political moves favoring Medicare Advantage and ACA stabilization could help OSCR
🌟 Outlook
Factor Impact on OSCR
⚠️ Downside risks Rising healthcare costs; regulatory uncertainty
✅ Upside catalysts Medicare Advantage tailwinds; continued execution & expansion
📉 Tech-driven momentum AI investments, ICHRA adoption, and growing RS rating (>90)
🔄 Volatility Meme-like spikes add risk—but also opportunity
🧭 Final Take
Trump tariffs on pharma won’t directly hit OSCR, but rising drug costs could hurt insurers if passed along to consumers.
Policy outlook (Medicare Advantage, ACA support) matters—bullish under Trump, bearish under heavier regulation.
OSCR is fundamentally a growth-tech-insurance stock, not a pharma or tariff play.

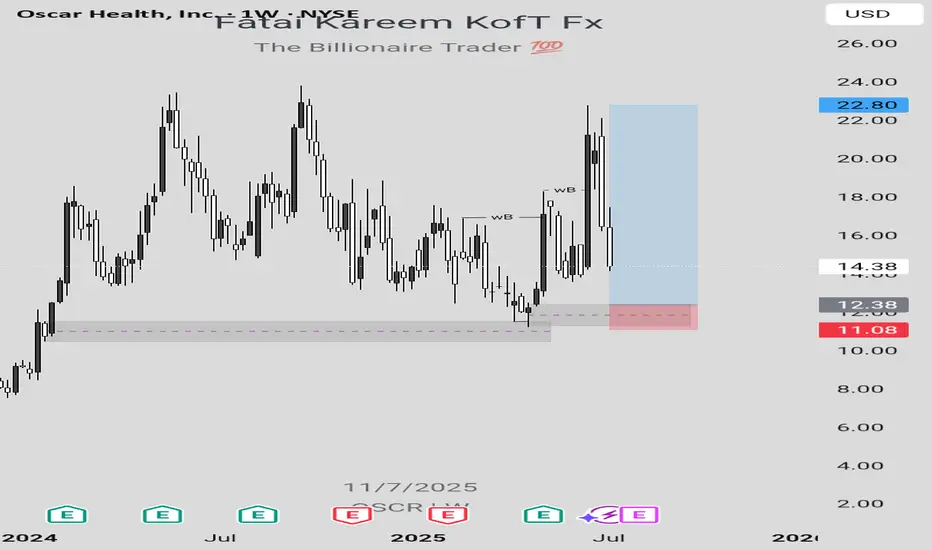
OSCR LONG IDEALooking at the weekly chart of OSCR stock, there's a long opportunity which can be taken advantage of to make some money provided that market follows the projection.
In order to take advantage of this long opportunity, a buy order limit can be placed at $12.38 while the exit can be at $11.09 and the final target can be at $22.80.
Confluences for this long idea are as follows:
1. Weekly break of structure
2. Valid Inducement (structural liquidity)
3. Orderflow
4. Sweep
5. Valid demand zone in the discount level
6. Imbalance
7. Pattern confirmation formed after mitigation of a demand zone indicating that there's a bullish change of trend.
Disclaimer: This is not a financial advice. The outcome maybe different from the projection. Don't take the signal if you're not willing to accept the risk.
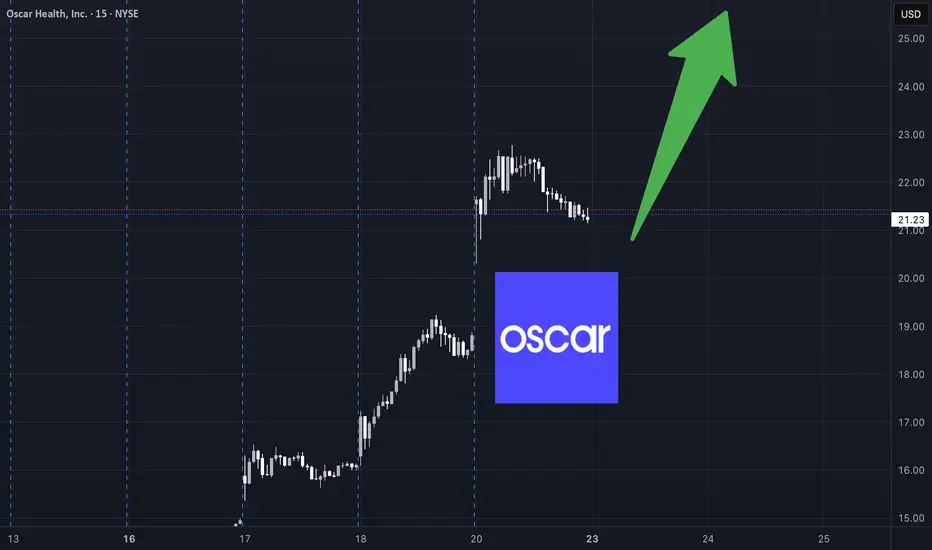
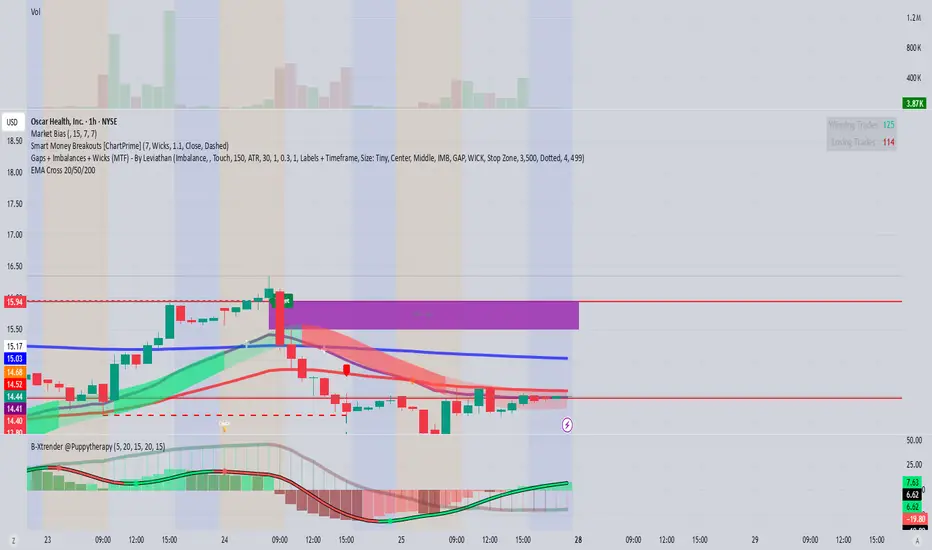
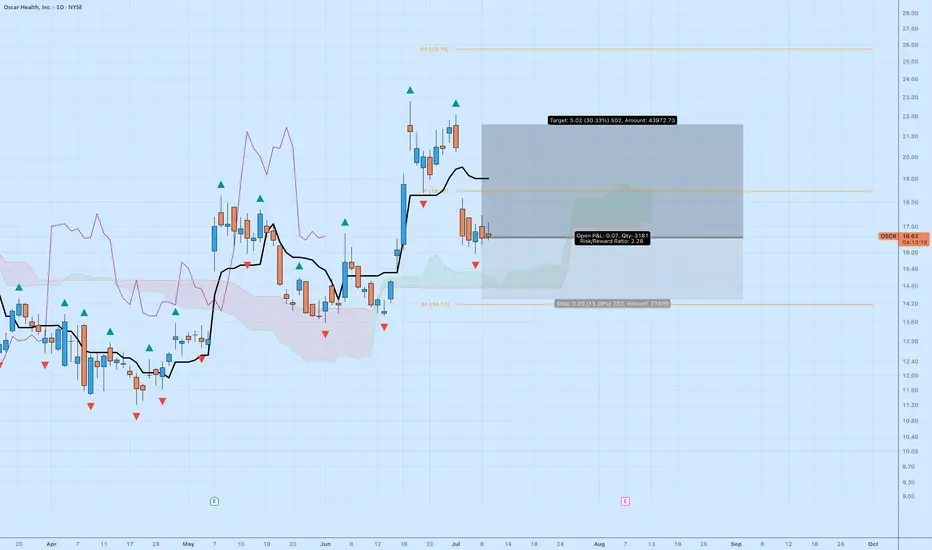
OSCR: Pullback Setup with 30% UpsideOscar Health NYSE:OSCR has pulled back into a logical area of support after a strong breakout in June. While the aggressive move may be over, this trade still offers solid upside with controlled risk.
🔍 Technical Breakdown
Price is basing above the cloud with a clean series of higher lows.
Ichimoku: Trend remains bullish, and price is holding the Kijun-sen.
MACD not shown, but momentum has stabilized after the initial thrust.
🎯 Trade Setup
Entry: ~$16.60
Target: $21.62 (+30.33%)
Stop: $14.40 (–13.29%)
Risk/Reward: 2.28 — attractive given current market conditions
This is a measured continuation setup — not aiming for the moon, just a reasonable trend extension.
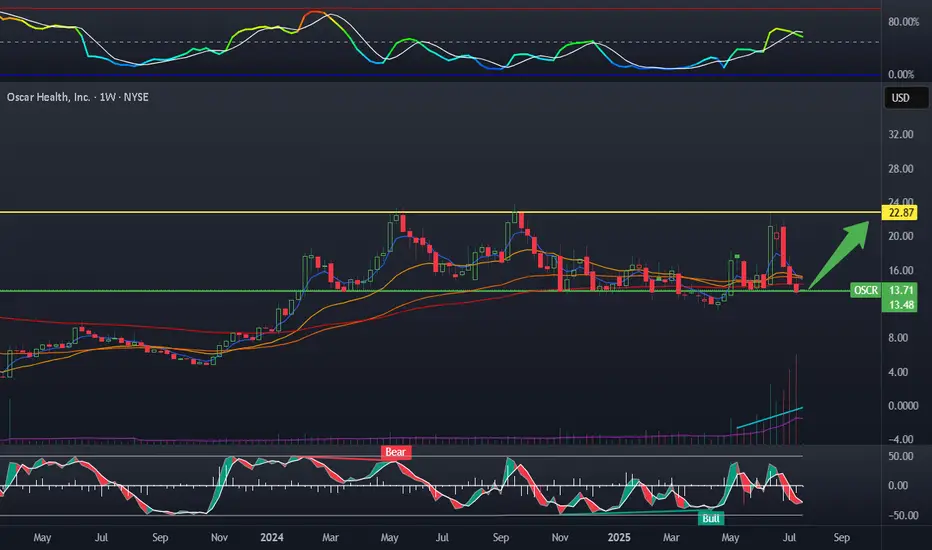
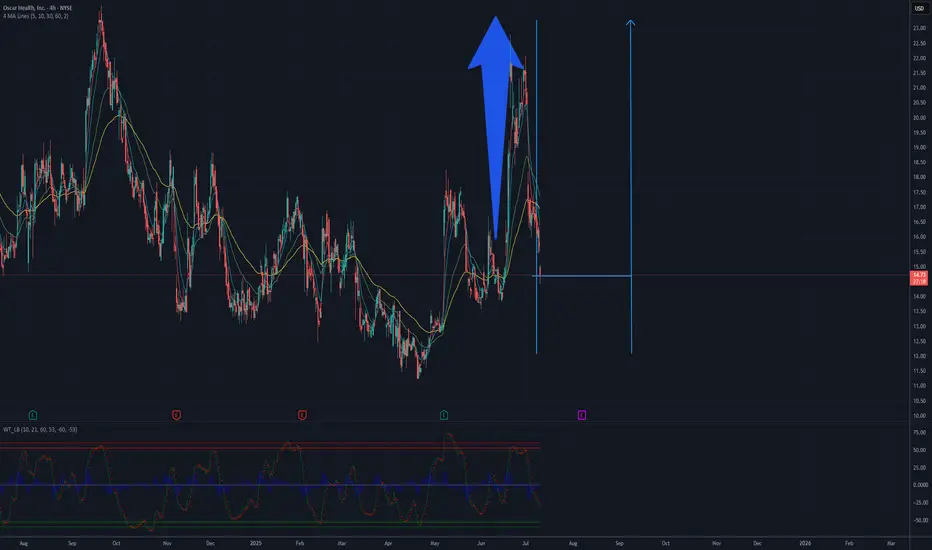
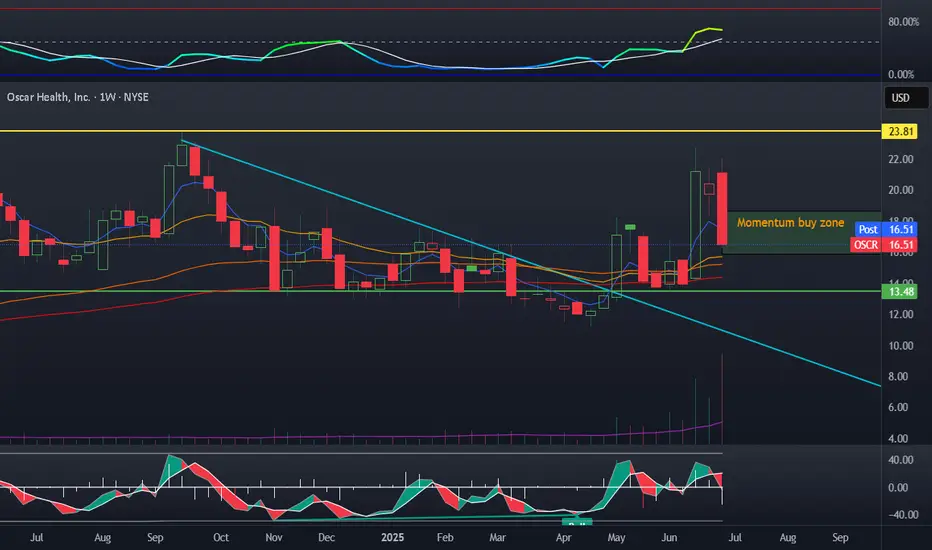
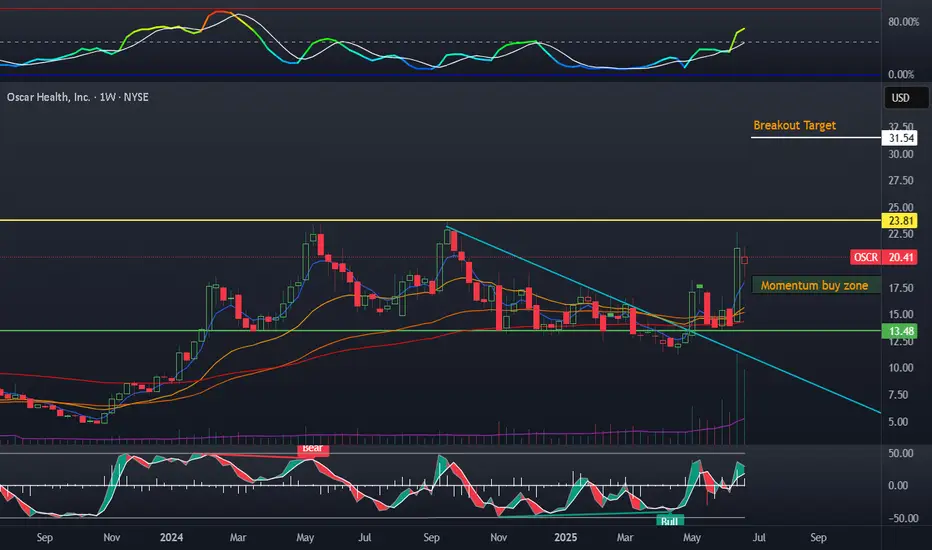
Oscar Health Bullish Continuation Oscar Health has broken out of a long descending wedge and is now resuming its broader bullish channel trend. With volume surging and smart money signals appearing near key supports, the chart targets a 94% measured move to $26.76, with the possibility of continuation toward $50.00 if trend strength persists.
A strong bullish structure remains valid as long as price stays above $13.68.

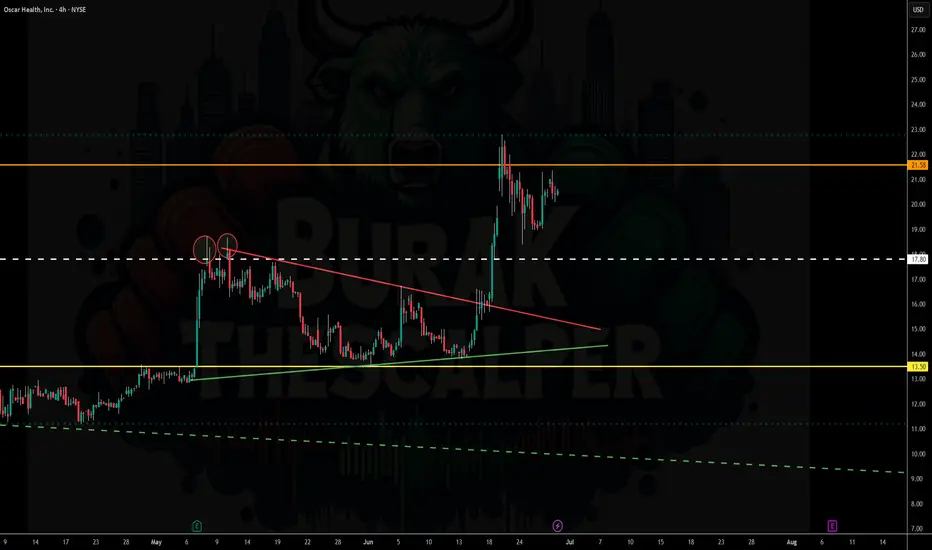
Potential Upside for OSCR.US – Targeting $23Oscar Health (OSCR.US) is currently trading near the technical support zone of $14–$15, a level that has historically acted as a base for rebounds. In May and June 2025, the stock saw sharp upward movements, breaking through the $20 mark, which confirms strong bullish potential. The current pullback may offer a buying opportunity before another upward leg. Once the resistance at $18–$20 is cleared, a move toward $23 — the September 2024 high — appears achievable. This scenario is supported by the technical setup and past price reactions at these levels.
Potential TP: 23 usd
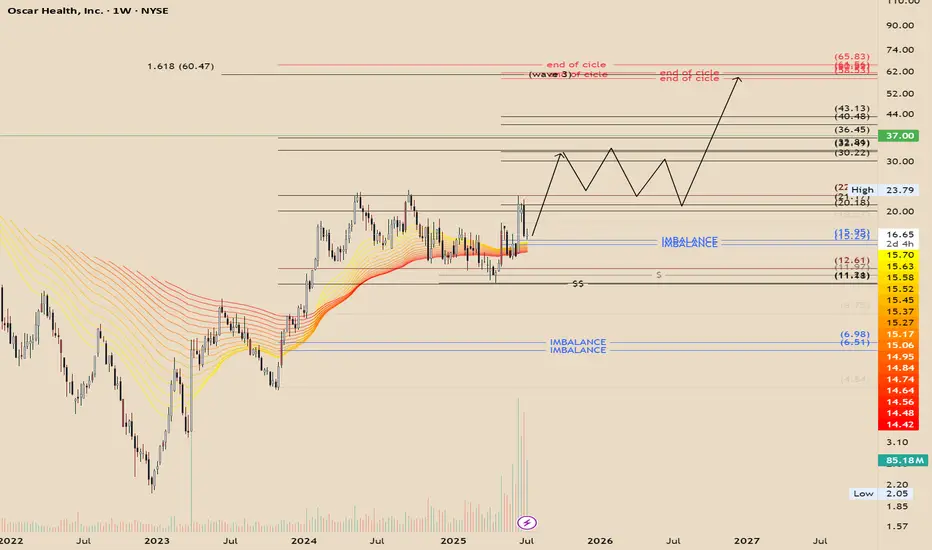
OSCR - Cyclical Expansion and Algorithmic ConfluenceOscar Health moves in cycles. It's possible to observe algorithmic confluence with the 3rd extension at 1.618 (~$60). The price reacted to the algorithmic expansion channel as expected and retraced to the equilibrium of the weekly bullish breaker. Therefore, the price behavior I anticipate is an aggressive expansion toward the next algorithmic level around $30, potential consolidation thereafter, and a final expansion toward the end-of-cycle target in the $60s.
This analysis is purely speculative and for educational purposes only.
OSCR: A bored phase accumulation before next up viewOSCR: A bored phase accumulation before next up view.
Consolidating in a tight range to absorb remaining supply before resuming the uptrend.
.
US STOCKS- WALL STREET DREAM- LET'S THE MARKET SPEAK!

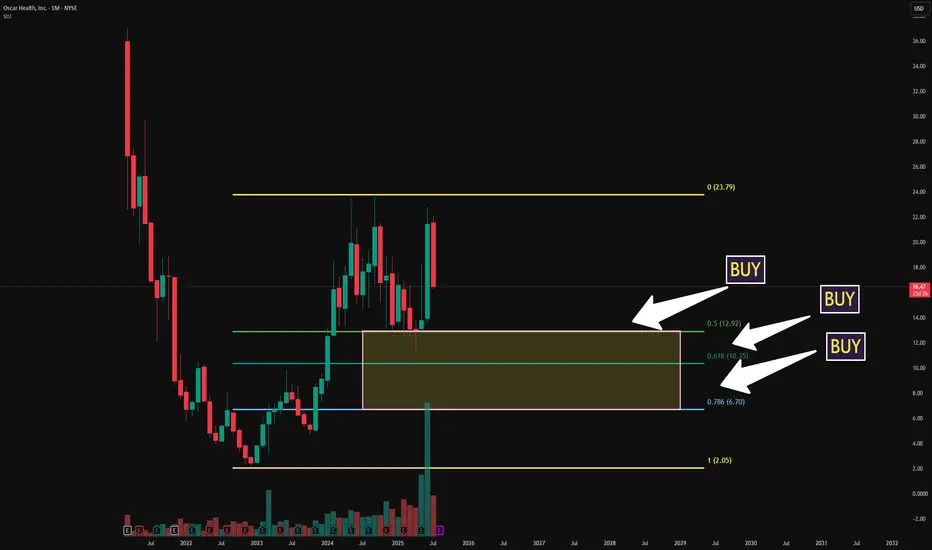
$OSCR ONCE IN A LIFETIME Fibonacci Pyramid Long Term PlanNYSE:OSCR ONCE IN A LIFETIME Fibonacci Pyramid Long Term Plan
Buys: 12.92 10.35 6.70 Target 30🎯
When I posted these pull backs people thought I was crazy now be ready
I plan to LAYER OPTIONS and SHARES
Drop a LIKE if ur DOWN!
OSCR a buy OSCR I have added to the position after the correction. Ive had a few rounds of covered calls collected. We note a nice FUD based correction on the stock, this will allow stochastic to fall alongside volatility. This will also allow the moving averages time to catch up.
My plan:
Sold 16$ CSP, bought shares around 16$, sold covered calls when price was higher, today I also bought 20$ September calls.
$OSCR long PT: $30-60 range- Undervalued Healthtech company growing revenue double digits.
- PEG < 1

[OSCR] OSCR InvestmentInvestment on this healthcare stock for the long term.
I am expecting a huge upside move for the next months/years as it's the future of healtcare services. I want to hold it for a long time so let's see what it can offer us.
Great Trade !
7/1/25 - $oscr - Dip buying AH at mid 17s7/1/25 :: VROCKSTAR :: NYSE:OSCR
Dip buying AH at mid 17s
- stock running for good reason
- NYSE:HIMS of insurance type
- NYSE:CNC is pee'ing in the narrative, but NYSE:OSCR guide unaffected
- I'd expect to pick up a MSD gain here
- I have limits into the 16's tn where i'd rather own more
V

Oscar (OSCR) – Tech-Enabled Healthcare with Margin Momentum Company Snapshot:
Oscar NYSE:OSCR Health is a technology-focused health insurer leveraging data and digital platforms to deliver affordable, personalized care. Its platform-centric model improves member experience, cost control, and care outcomes—setting it apart in a highly regulated sector.
Key Catalysts:
Steady Execution Under Proven Leadership 🧠
CEO Mark Bertolini (ex-Aetna) brings credibility and strategic clarity, reinforcing investor trust in Oscar’s long-term viability.
Focus remains on operational discipline, risk management, and scalable infrastructure.
2025 Guidance Reaffirmed 📊
Following a solid quarter, Oscar reaffirmed full-year 2025 guidance, projecting margin expansion and sustained growth despite sector headwinds.
Medical loss ratio (MLR) held steady at 75.4%, absorbing a $31M prior-period hit—showing resilience in cost containment.
Robust Financial Flexibility 💰
With $1B+ in free cash flow, Oscar is well-positioned for:
Organic growth in new markets
Potential share buybacks or dividends
Continued investment in digital infrastructure
Investment Outlook:
Bullish Entry Zone: Above $17.00–$17.50
Upside Target: $32.00–$33.00, supported by margin stability, capital strength, and smart execution.
🩺 Oscar is transforming health insurance from reactive to predictive—backed by tech, discipline, and capital strength.
#OscarHealth #OSCR #HealthTech #InsurTech #DigitalHealth #MarkBertolini #MedicalLossRatio #FreeCashFlow #TechEnabledCare #HealthcareStocks #Bullish #ValueDelivery #HealthInnovation

OSCR played out, where to DCA?OSCR played out nicely with a huge pop off price action. I was able to sell my leaps, and have already realized a few weeks of unassigned covered-calls. During the bounces near the bottom zone I was adding every few days. Where do I plan on averaging up? Around 17.5$ if we get there. I will also sell CSP within this zone.
Oscar like hims challenges the big legacy model of healthcare. The 24$ zone will continue to be an area of huge resistance. This is the highest volume the stock has ever had, a good sign.
here is the #chart for $OSCR Neutral with upside potential. Oscar Health ( NYSE:OSCR ) is at $20.41, down 0.34% daily but up 36.43% monthly, as shown in the finance card above. X posts highlight strong bullish sentiment, with a weekly wedge breakout and high volume fueling optimism for a move toward $25-$30. Fundamentals are solid, with 42% Q1 2025 revenue growth, $1.2B net cash, and 660% EPS growth projected for 2025. However, volatility (13% weekly) and a downgrade to Market Perform by Raymond James (price target cut to $18) signal caution. Support is at $19.50-$20; resistance is at $21.36-$23.79. A breakout above $21.36 could target $25, but earnings concerns and a high valuation (255% premium per Morningstar) cap near-term upside
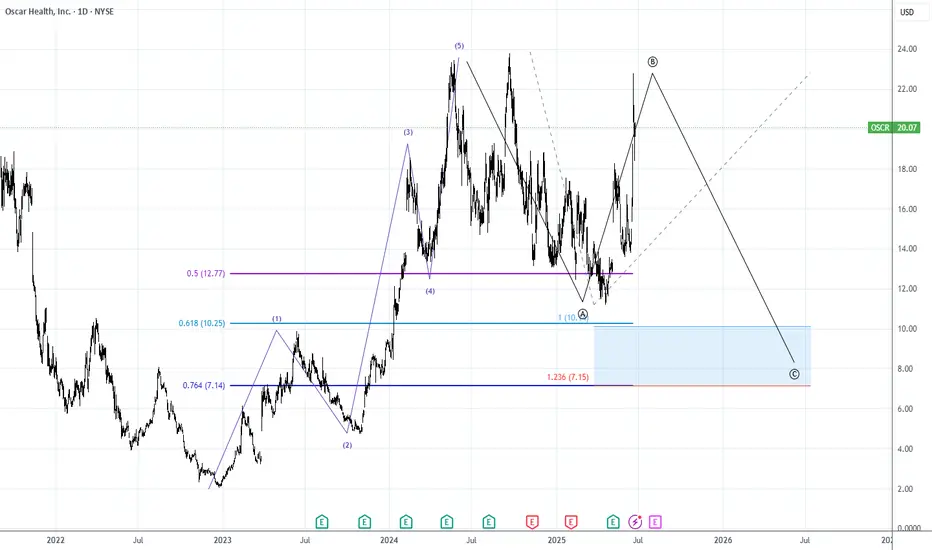
EW OSCR unpopular opinionJust my thoughts. Not financial advice. ABC correction showing a lower low possibly to the 0.618 or 0.764 fib level.
OSCR Weekly Trading Plan – June 20, 2025🟢 OSCR Weekly Trading Plan – June 20, 2025
🎯 Instrument: OSCR (Oscar Health)
📈 Direction: Long (Shares)
📊 Confidence Level: 72%
⏰ Time Horizon: 3–4 Weeks
⚠️ Market Condition: Volatile, meme-stock behavior, overbought risk
🧠 Model Consensus Snapshot
Model Direction Key Takeaways
DS 🔻 Short RSI 76, euphoric price surge, meme risk; targets $17.50
LM 🔼 Long Still bullish above $20.50, target $22.55, careful sizing
GK ⏸️ Watch Wait for dip to $19.25–$20.50, bullish bias if pullback
GM ⏸️ Watch Avoid for now, entry only if retesting $19.50
CD 🔼 Long Trade at open with $26.50 target; wide stop at $18.50
🧾 Summary & Final Decision
📌 Overall Market View:
Strong short-term uptrend is still active, but all models agree we are at overbought RSI levels. The price has surged ~50% in 5 days — historically unsustainable for "meme-like" setups.
📉 Bearish Risks:
RSI > 75
Elevated VIX = increased whipsaw risk
Meme-stock volatility
Potential for profit-taking or rug-pull behavior
📈 Bullish Catalysts:
Technical breakout confirmed above key EMAs
High volume + news momentum
Heavy interest from social media channels
✅ Final Trade Recommendation
Parameter Value
📉 Direction LONG (Shares)
💵 Entry Price $21.00 (limit open)
🛑 Stop Loss $18.50
🎯 Target Profit $26.50
🔢 Size 12 shares (based on $10K acct, ~2.5% risk)
📅 Holding Period 3–4 weeks
📈 Confidence 72%
📌 NOTE: Reduce size and tighten stops if market volatility continues rising next week.
📊 TRADE_DETAILS (JSON Format)
json
Copy
Edit
{
"instrument": "OSCR",
"direction": "long",
"entry_price": 21.00,
"stop_loss": 18.50,
"take_profit": 26.50,
"size": 12,
"confidence": 0.72,
"entry_timing": "open"
}
⚠️ Risk Considerations
Overbought RSI: Expect choppiness and high risk of short-term reversal.
Meme stock volatility: News, Reddit chatter, or influencer tweets may spike/dump price irrationally.
VIX > 20: Use limit orders to avoid bad fills on open.
💡 This is a high-risk, high-reward momentum play. Stick to your stop-loss and use small sizing.