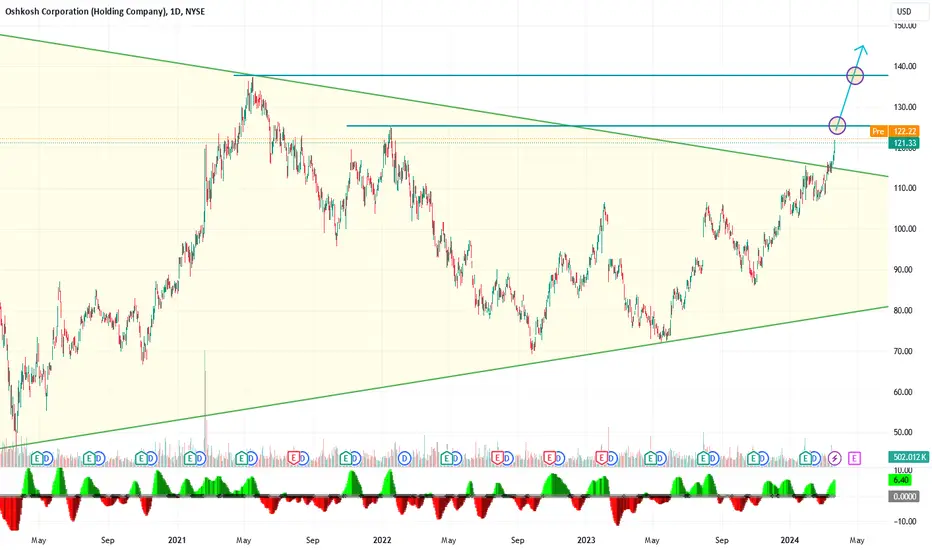
OSK eyes on $125.42/52: Double Golden Fibs likely to Orbit a bitOSK has been rising with the market and industrials.
It is hst just hit Dual Golden fibs at $125.42-125.52
Expecting a few orbits and possible dip from here.
.
This pair of Fibs called THE PREVIOUS TOP:
.
The smaller Golden Sisters also called THE BOTTOM:
Hit the BOOST and FOLLOW for more such PRECISE and TIMELY charts.
=============================================================
.
OSK trade ideas

OSH KOSH SELL it B'Gosh!OSH KOSH B'GOSH is over extended here and at resistance! I would add every $2 increments on a starter position here, should easily retrace to $117 and $108 in coming weeks

OSK eyes on $88.82-89.24: Key Resistance to Tariff Relief bounceOSK bounced into a key resistance after Tariff pivot.
Mostly US based company so almost immune to tariffs.
Currently testing first fib support so maybe ready to go.
$ 88.82-89.24 is the exact resistance zone of interest.
$ 86.66 is first (minor) fib support for bulls to hold.
================================================
.

OSK heads up at $125.52: long term Double Top? or break to Pop?OSK just hit a double-fib at 125.42/52.
Both are Golden ratios (.618 multiples).
Could double top here or break and run.
.
"Double Top" as in the previous rejection exactly from this double fib:
Perhaps not exactly a double top since it had gone higher, but a major barrier nonetheless.
.
If it breaks the $125 fibs, it could run to $143-145 very quickly:
So this is a key level to watch and consider next actions.
=======================================================================================
.

Triangle breakoutPrice is breaking triangle exiting upside
A closing above 125.16$ activate next target at 138$
A strong upside move can happen soon
Symmetrical triangle There is a huge symmetrical triangle forming in the last 4 years
Price can break upside at 116$ or bounce down again

$OSK Breaking Out of Flag Formation?NYSE:OSK Here is another play on electrified specialty vehicles. Check out their website www.oshkoshcorp.com Pretty cool stuff.
I have been watching this one for a good entry since earnings on Oct 23rd. I missed the pullback breakout on Nov 13th, but it has pulled back again and looks to be breaking back above that pullback. I have started ¼ sized position and I will place my stop just below today’s low of day. I do not expect this to be barn burner but a 10% to 20% gain over the next 2 months seems reasonable. I think it can get back to the double top highs from September. All TBD.
Ideas, not investing / trading advice. Comments always welcome. Thanks for looking.

Waiting for breaking out channelBest scenerio. Waiting for breaking out channel and buy entry set up.
Wait n see!

OSK. looking for the intersections. its a challenge.Markets are very difficult things to predict. This is why we ultimately fall to the side of system trading. It's just too unpredictable. You might have a lot of fun coming up with the perfect answer to each and every chart setup, but it is better in the long run to let your problem solving nature focus on other aspects of life. Even if it's just a short break, if you are tired of analyzing then just take that break. Maybe you earned it, maybe you didn't, that's not really the point at this particular junction. Just take a break and relax those analysis corpuscles. You will thank me later. Maybe.

$OSK wins 9 BILLION USD contract with USPS - Bull Flag CONFIRMEDDefense contractor Oshkosh Truck Corp. (NYSE: OSK) won a 10-year contract to build next-generation delivery vehicles (NGDVs) for the U.S. Postal Service, beating out electric delivery van maker Workhorse Group Inc.
DROP $WKHS for $OSK as soon as possible! You will thank me later!
SUPER LONG!


OSK - contract winUpdated previous chart my mistake in drawing line...
10year USPS contract. Were going to ride the momentum here. Just play the pinbar or bullish candle strategy off the MA while it trends up and you should make some nice profit!
Good luck!

Oak - rejectedTop of weekly trendline acted as strong resistance. You need to see the smaller timeframe Before considering possibly squeezing more out with what momentum may be left out of this but I would wait and catch a ride down.
If you like my charts like/follow! message me for more.

OSK watch long-term resistanceWe are looking at OSK for long term resistance at the 98 level. If we can break above and close over 99.8-100 we could see a 10-15% gain in the market. Looking for 115 at that point


SHKOSH CORPORATION PUBLICATION DailyHey my friends, SHKOSH CORPORATION is in a fake bearish setup with high sell volume executed and a long legged doji. On the TIMEFRAME M1 we see an upside down hammer candle with a high volume of sales issued, it seems that the booklet. Either make it empty it go in the direction of its last previous lower which is at the level of the lowest of the bollinger. After the reversal she will go to test the VWAP breaking the highest of the bollinger and come to the top of the equilibrium zone to test it.
Great possibility of breaking the price at the same time the zone with the force of the momentum join the new zone and reach the next high. Access several higher ones before going to the top of the equilibrium zone to test it. And get to the top of the bullish channel with symbolic figure of 102.00.
Please LIKE & FOLLOW, thank you!

OSK - gapped down right into demand zoneOSK's demand zone can be seen clearly on the weekly chart. The fear in the markets this week saw it gapped down into the middle of the demand zone yesterday. It hit a low of 54.30 and started to rise (with a pin bar on the 15min). By the time I longed it was closed to the top of the zone. A small position as the SL is rather far away at 51.40 and looking to scale out as and when it reaches the fib levels on the way up. I would also scale my trailing stops up as the market is just so volatile this period!
Disclaimer: This is just my own analysis/opinion for discussion and is not a trade advice. Kindly do your own due diligence and trade according to your own risk tolerance. Thank you.

OSK BTD off Symmetry SupportThis came to me in meditation, and this is a good thing, usually. The chart is ugly with no great trend, but this is what I'm given. I do technicals and then a "reading" with my pendulum and cards.
What I'm seeing:
- weekly timing just counting bars, and it appears to be in a weekly timing window.
- 200 EMA at $83.42, 50 week MA $82.45, weekly ATR trailing stop just above there and Symmetry support at $81.76
- I like the zig zag pattern down.
- The "reading" indicates we expect to dip below last week's low ($83.62) and reverse. I feel good about the message and the way it lines up with the technicals. I'm looking for a 5% gain this week ($86.55 from entry) and then I'm out.
- Entry ~ $82.43 near 50% retracement
- Stop is a daily close below $81.76 (sym. support)

Ending and igniting volume with hammer on supportDISCLAIMER. This post is for educational purposes only and should not be construed as investment advice. Your use of the stock observations is entirely at your own risk and it is your sole responsibility

OSK: Sort opportunityAn intraday high potential, Back Tested Sort Analysis.
We ll try to enter into the correction of the uptrend movement.
DETAILS ON THE CHART
NOTE: Entry range area above the entry point, is calculated upon 80% of the recorded pullback back tested past performances
DISCLAIMER: This is a technical analysis study, not an advice or recommendation to invest money on.


Long trade IdeaLooking for break above RSI uniformity line on high volume. The pull back to this level presents a decent RR oppurtunity
