PINS trade ideas

PINS Good Opportunity Ahead of Earnings? [LONG]Pins in a great spot after the PYPL news was reverted, over reaction ahead of earning in my personal opinion. Still bullish LONG term.
More risk adverse investors will likely want to wait until after Q3 earnings. But my outlook is long-term so i'm happy to add to my DCA position here.
Short-Mid term:
Bullish divergence on the daily and weekly (MACD and Stoch)
Horizontal support with the 0.382 fib level
Oversold on Daily
Oversold on Weekly with money flow in the red (great upside from here)

PINS in a mess and might lose IPO VWAP 43 to settle at 36PINS after that pop is pushed down crazy now in a big mess. Market hitting all time highs this one reached critical level which is a VWAP from IPO. if $43 is lost then it could get ugly to find the bottom at 35 range.

PINS Wave Analysis and Personal ExpectationHey Folks,
Well I was working on several tickers and I thought why not sharing it with you guys. I rarely share my work as I don’t consider myself still good trader. A long long long way to go :D
However, assuming my wave analysis is correct, and actually we are still in wave 1 of bear trend, then I am expecting wave 2 to fill the gap it made several days ago then it will continue the bear trend as wave 3 to fill highlighted gap.
The weekly indicators is kinda bullish which makes me think, hmm, I might be right to fill the first gap as wave 2, and then going for wave 3.
Bear in mind that earning is coming next week and I am not an earning trader as it might change the whole thing analysis based on fundamentals.
I don’t own the stock and this is not a financial advise :D lets see how it goes

Will the gap act as a support?I think this level could be a good support before a new uptrend... I hope :)

Can you trade based on news?Bloomberg News reported Wednesday that PayPal is looking at purchasing the image-sharing social media platform, noting talks of a potential price of $70 a share, a level that would value Pinterest at around $39 billion.
In this analysis, you can see both sides of the same trade!
One is PayPal which experienced one of its worst days after the news came out they decided to buy Pinterest, on the other hand, PINS experienced its best trading day ever..!
It is very unlikely to be successful in trading/investing by following the news..!
Best,
Moshkelgosha

PINS - Gap Fill to the $70 level In PlayConfirmed buy-out offer at $70.00 for PINS by PYPL.
Turns this pattern into a bull-flag and makes the gap fill at $70.00 a definite possibility likely very soon.
(Opinion only)

$PINS | WEEKLY WATCHLIST 10/25After absolutely CRUSHING it on Pinterest last week, I have an updated chart overlook for this week. Just to recap, we entered long last week at $54 on the break of the downtrend. $PINS soared up to $66 on the news that PayPal was in talks to acquire them, and we have since secured profits.
I believe that was only the beginning of the big picture, and we put in a solid wave 1 last week. Looking to start averaging into a swing position in my buy zone around $52.61-56. From there, we should see an impulsive wave 3 up to fill the rest of the daily gap taking us to $70+. Really love this setup, but remember to wait for confirmation and average into your swing position to help mitigate some risk!

Playing Jan 2022 Calls $55 StrikeLooks to be basing Stage 1. Tooks Call position. Lets see how the Arc plays out. NYSE:PINS


PINS to $46 Gap fill and to $60$PINS
It has comedown quite a bit now if can fills that gap ($46) from 2020s then it good to go where the bottom will be in. Earnings gives some decent numbers it can fly back to $60

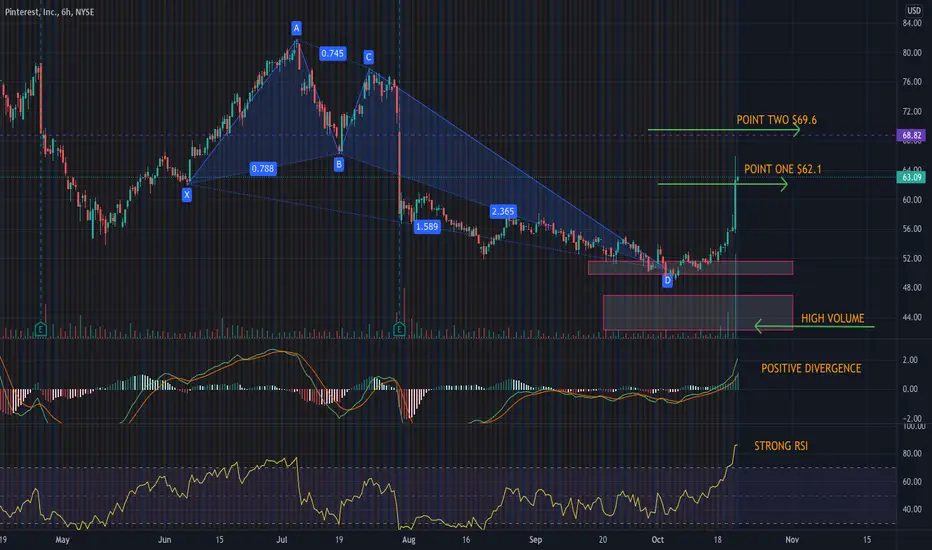
PINTEREST Bullish ButterflyPINS formed a bullish butterfly shape and bounced back from target, point one achieved and point two is $69.6.

Gap Fill- BullishWatching PINS closely here- Sold off after earnings, patiently waiting for a good entry- with a catalyst or an increase in buyer volume relative to seller volume should really pop- will be looking for a breakout broader market conditions permitting. Bullish, just some FIB levels along with some RSI-based supply and demand zones to keep an eye on.
- Big gap to fill on the upside
- Oversold on the RSI
- MACD is seemingly about to cross
PT1- $57.20
PT2- $58.85
PT3- $60.33+ Breakout

Let's make a deal!Paypal is in talks with Pinterest about a possible takeover. The price per share is being discussed in the neighborhood of $70. It would be around $39 billion. Potential earnings, if you go in at this point, could be 11%.
Watch closely, there could be pullbacks. You can exit the trade with a stop loss if it goes above the 61
❤️ If you find this helpful and want more FREE forecasts in TradingView
. . . . . Please show your support back,
. . . . . . . . Hit the 👍 LIKE button,
. . . . . . . . . . . Drop some feedback below in the comment!
❤️ Your Support is very much 🙏 appreciated!❤️
💎 Want us to help you become a better Stock trader?
Now, It's your turn!
Be sure to leave a comment let us know how do you see this opportunity and forecast.

$PINS Power of 3I started a position in PINS this morning as it looked to retake the 50 DMA. It has now done that and is a Power of 3 Set-up. You can see my stop on the chart. If thinking of taking a trade in PINS do so at your own risk. And, be aware that earnings are coming up very soon. Ideas, not investing / trading advice.
Here's a link if you don't know a power of 3 set-up: www.t3live.com

$PINS | WEEKLY WATCHLIST 10/17Pinterest has been consolidating in a long drawn-out bull flag since February 2021. I believe we are nearing the end of this corrective phase and have developed a shorter term wedge indicated on the chart.
I am looking for a break above that wedge aka the $54 level to go long. Targets above are $58 and $61. It's important to note we have quite a large unfilled Daily gap above from roughly $61-70.

PINSKeeping an eye on this one next week. Consolidating at the 1.618 extension with a bullish rsi divergence. Above the blue trend line could send it imo.

PINS BagholdersNYSE:PINS
The lines represent the price level that has been traded upon or will be traded.
The more it hit the line, the stronger the level.
It can be use to set profit taking price or stop loss price.
Every level is of same significant until order flow trades upon it.
DYODD.
Volume profile for past 200 daily shows that main volume at 71.xx.
Look out for next earning report.

Pintrest ideaBach G minor - a melodist bullish harmonically areas, we wait for the price to fall within one of these ranges and start buying upon bullish sentimental power, wax on, wax off.

AB = CDThe AB leg is Down in a bullish AB-CD pattern and in the bearish version the AB leg is upward. This pattern is not always equal and the CD leg can be shorter or an extension of the AB leg. In this case it is very close to Equal.
It is good to wait for confirmation when price hits D in this pattern. Possible stop under D.
The retracement of AB (from B to C) can be between 38.2% to 78.6% of the A-B leg, however, an ideal pattern has a retracement of 61.8% to 78.6%. This one is .786.
This differs from the pattern I call ABC bullish (which is an ABCD pattern, but the target is D) as the second valley is lower than the first one. In an ABC bullish pattern, C has to be higher than A.
Any pattern can fail. No recommendation.
I see re-opening as the trade right now so am watching this one. I was just curious as to why this one popped a bit today.
I have found it is easier to watch a few than a bunch (o:

PINS Possible Butterfly at critical inflection point. Could be getting close to a reversal here. Id really like to see 48.75 hold up, but harmonically speaking, it wouldnt be strange to hit the 1.272 on the orange butterfly. Thats also confluent with 46.23 which is the old resistance before we made the move to 68.93 - Thatd also be the first target up, 76 and 81 would be the harmonic targets, but looking at the price action correlation above 68.93, the real target would be 86 if it broke up from there
