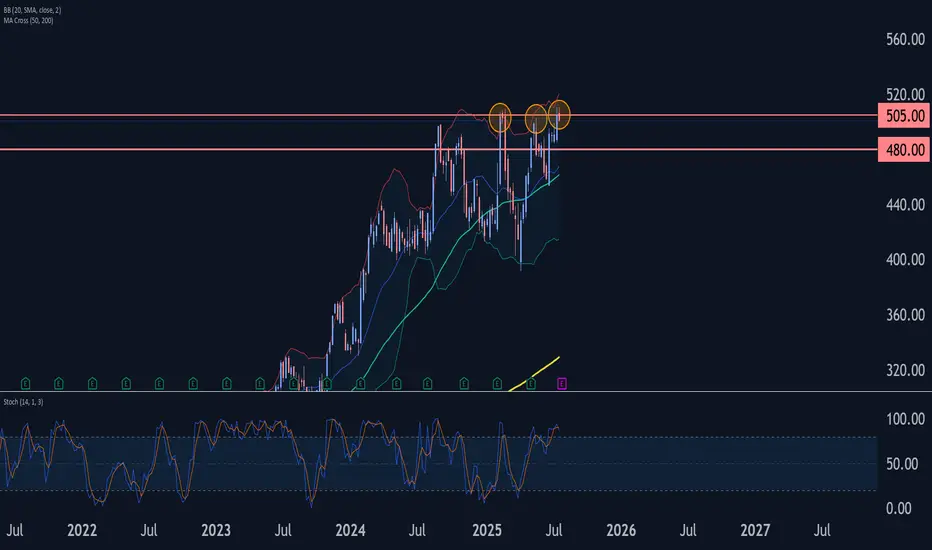
Race Wave Analysis – 22 July 2025
- Race reversed from long-term resistance level 505.00
- Likely to fall to support level 480.00
Race recently reversed down from the strong long-term resistance level 505.00, which has been reversing the price from the start of 2025, as can be seen below.
The resistance level 505.00 was strengthe
Next report date
—
Report period
—
EPS estimate
—
Revenue estimate
—
9.54 USD
1.58 B USD
6.91 B USD
126.06 M
About FERRARI
Sector
Industry
CEO
Benedetto Vigna
Website
Headquarters
Maranello
Founded
2016
ISIN
NL0011585146
FIGI
BBG009PH3Q86
Ferrari NV is a holding company, which engages in the design, engineering, production, and sale of luxury sports cars. The firm's models include the F12Berlinetta, 488GTB, 488 Spider, 458 Speciale, California T, the LaFerrari Hybrid, LaFerrari, and the FF four-wheel drive. It participates in car racing such as Formula One. The company was founded by Enzo Anselmo Ferrari in 1939 and is headquartered in Maranello, Italy.
Related stocks
Is Ferrari's stock still bullish?Is Ferrari's stock still bullish?
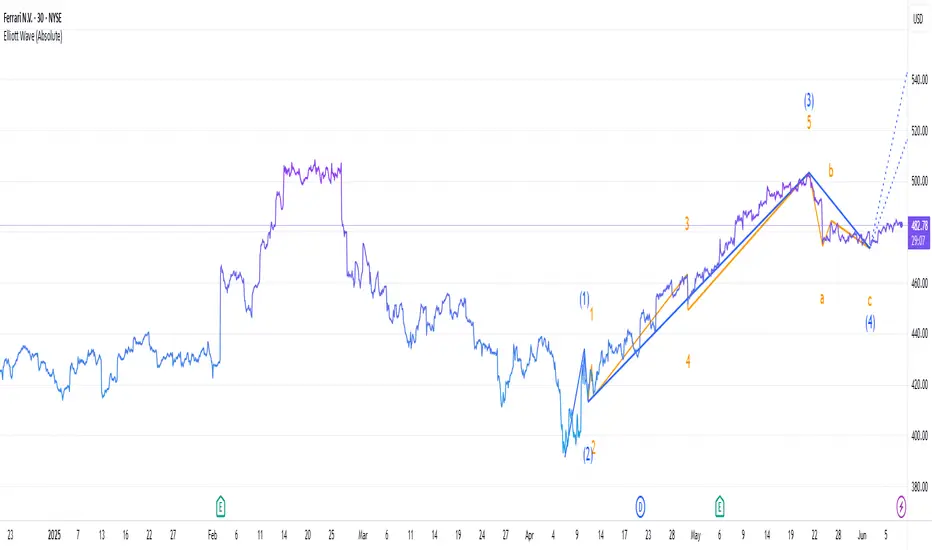
Technical Outlook
Elliot Wave theory suggests a cautious bullish stance. The present correction seems to be a temporary setback, likely driven by guidance and tariff fears, but sets the stage for a potential rally to $520-$540 if support is not broken. However,
RACE Wave Analysis – 22 May 2025- RACE reversed from round resistance level 500.00
- Likely to fall to support level 460.00
RACE earlier reversed from the strong resistance area between the major round resistance level 500.00 (which has been reversing the price from the middle of 2024) and the upper weekly Bollinger Band.
The la

RACE (Ferrari) LONG SET UPEntry 1 $450.00
Entry 2 $440.00
Stop loss $430.00
Take profit 1- $460
(Close 33%)
Take profit 2- $480.00
(Close 66%)
Take profit 3-$500.00
(Close 100%)


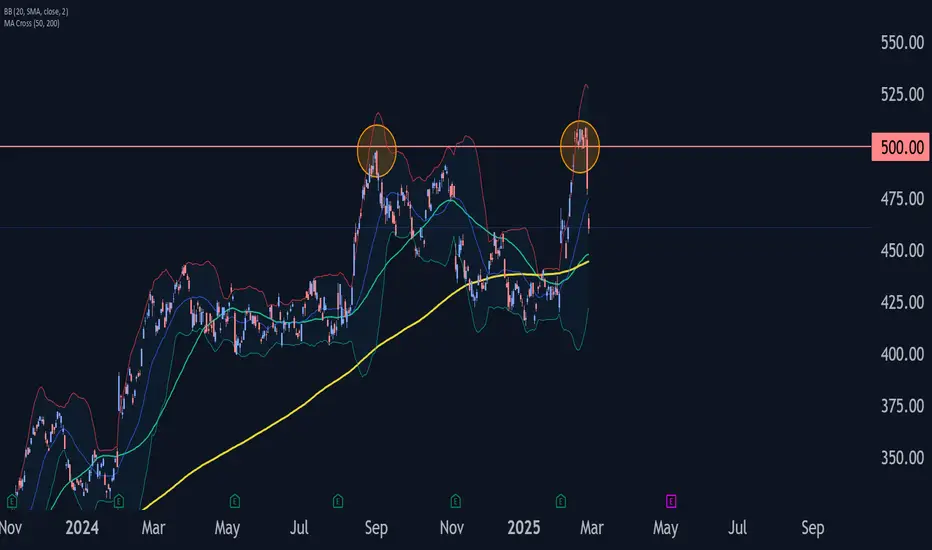
Ferrari Wave Analysis – 27 February 2025
- Ferrari reversed from round resistance level 500.00
- Likely to fall support level 440.00
Ferrari recently reversed down from the resistance zone between the round resistance level 500.00 (previous yearly high from 2024) and the upper weekly Bollinger Band.
The downward reversal from t
One Good Pullback Report? I decided to give a very quick run down of the stocks I am looking to trade or am already trading. Combining one good trade with the morning pullback report. I am heading to Puerto Vallarta tonight on a road trip so this was a quick and easy way for me to save time.

Ferrari Is Looking Ready To RaceThat's right, a bad play on puns... I'm not even a dad yet lol.
Momentum is favoring RACE big time. It is setting up for a really strong pullback.
Touch of the Keltner channel
Gap up from earnings (earnings drift in our favor)
Anti setting up on the MACD
Momentum on MACD daily and weekl

RACE (Ferrari) – Quality has its PriceMIL:RACE has a technically interesting setup that also fits well with the weekly setup that I presented a few weeks ago.
The current consolidation has once again reached the lower zone and should find support from here one more time. Recently, a significant bounce was achieved from here seve

Ferrari - Don't Miss Out on 50% ROI!Very strong setup here. Ferrari respects the SMA200 for years and did touch the SMA200 and bounce from it. It also respected the current trendline and the SMA200 and trendline bounce did happen at the 23rd Fib retrace level. Very bullish setup.
--
🐂 Trade Idea: Long - RACE
🔥 Account Risk: 20.00%

See all ideas
Summarizing what the indicators are suggesting.
Neutral
SellBuy
Strong sellStrong buy
Strong sellSellNeutralBuyStrong buy
Neutral
SellBuy
Strong sellStrong buy
Strong sellSellNeutralBuyStrong buy
Neutral
SellBuy
Strong sellStrong buy
Strong sellSellNeutralBuyStrong buy
An aggregate view of professional's ratings.
Neutral
SellBuy
Strong sellStrong buy
Strong sellSellNeutralBuyStrong buy
Neutral
SellBuy
Strong sellStrong buy
Strong sellSellNeutralBuyStrong buy
Neutral
SellBuy
Strong sellStrong buy
Strong sellSellNeutralBuyStrong buy
Displays a symbol's price movements over previous years to identify recurring trends.
Curated watchlists where RACE is featured.

Frequently Asked Questions
The current price of RACE is 517.65 USD — it has increased by 0.28% in the past 24 hours. Watch Ferrari N.V. stock price performance more closely on the chart.
Depending on the exchange, the stock ticker may vary. For instance, on NYSE exchange Ferrari N.V. stocks are traded under the ticker RACE.
RACE stock has risen by 1.85% compared to the previous week, the month change is a 8.29% rise, over the last year Ferrari N.V. has showed a 26.63% increase.
We've gathered analysts' opinions on Ferrari N.V. future price: according to them, RACE price has a max estimate of 643.72 USD and a min estimate of 422.88 USD. Watch RACE chart and read a more detailed Ferrari N.V. stock forecast: see what analysts think of Ferrari N.V. and suggest that you do with its stocks.
RACE reached its all-time high on Jul 25, 2025 with the price of 519.10 USD, and its all-time low was 31.66 USD and was reached on Feb 11, 2016. View more price dynamics on RACE chart.
See other stocks reaching their highest and lowest prices.
See other stocks reaching their highest and lowest prices.
RACE stock is 1.32% volatile and has beta coefficient of 0.31. Track Ferrari N.V. stock price on the chart and check out the list of the most volatile stocks — is Ferrari N.V. there?
Today Ferrari N.V. has the market capitalization of 92.29 B, it has increased by 0.31% over the last week.
Yes, you can track Ferrari N.V. financials in yearly and quarterly reports right on TradingView.
Ferrari N.V. is going to release the next earnings report on Jul 31, 2025. Keep track of upcoming events with our Earnings Calendar.
RACE earnings for the last quarter are 2.49 USD per share, whereas the estimation was 2.47 USD resulting in a 0.83% surprise. The estimated earnings for the next quarter are 2.80 USD per share. See more details about Ferrari N.V. earnings.
Ferrari N.V. revenue for the last quarter amounts to 1.94 B USD, despite the estimated figure of 1.92 B USD. In the next quarter, revenue is expected to reach 2.16 B USD.
RACE net income for the last quarter is 445.34 M USD, while the quarter before that showed 398.26 M USD of net income which accounts for 11.82% change. Track more Ferrari N.V. financial stats to get the full picture.
Yes, RACE dividends are paid annually. The last dividend per share was 3.39 USD. As of today, Dividend Yield (TTM)% is 0.68%. Tracking Ferrari N.V. dividends might help you take more informed decisions.
Ferrari N.V. dividend yield was 0.72% in 2024, and payout ratio reached 35.27%. The year before the numbers were 0.80% and 35.36% correspondingly. See high-dividend stocks and find more opportunities for your portfolio.
As of Jul 27, 2025, the company has 5.43 K employees. See our rating of the largest employees — is Ferrari N.V. on this list?
EBITDA measures a company's operating performance, its growth signifies an improvement in the efficiency of a company. Ferrari N.V. EBITDA is 2.87 B USD, and current EBITDA margin is 38.32%. See more stats in Ferrari N.V. financial statements.
Like other stocks, RACE shares are traded on stock exchanges, e.g. Nasdaq, Nyse, Euronext, and the easiest way to buy them is through an online stock broker. To do this, you need to open an account and follow a broker's procedures, then start trading. You can trade Ferrari N.V. stock right from TradingView charts — choose your broker and connect to your account.
Investing in stocks requires a comprehensive research: you should carefully study all the available data, e.g. company's financials, related news, and its technical analysis. So Ferrari N.V. technincal analysis shows the buy rating today, and its 1 week rating is strong buy. Since market conditions are prone to changes, it's worth looking a bit further into the future — according to the 1 month rating Ferrari N.V. stock shows the strong buy signal. See more of Ferrari N.V. technicals for a more comprehensive analysis.
If you're still not sure, try looking for inspiration in our curated watchlists.
If you're still not sure, try looking for inspiration in our curated watchlists.