PioneersA company specialized in the manufacturing of zero-gravity objects.
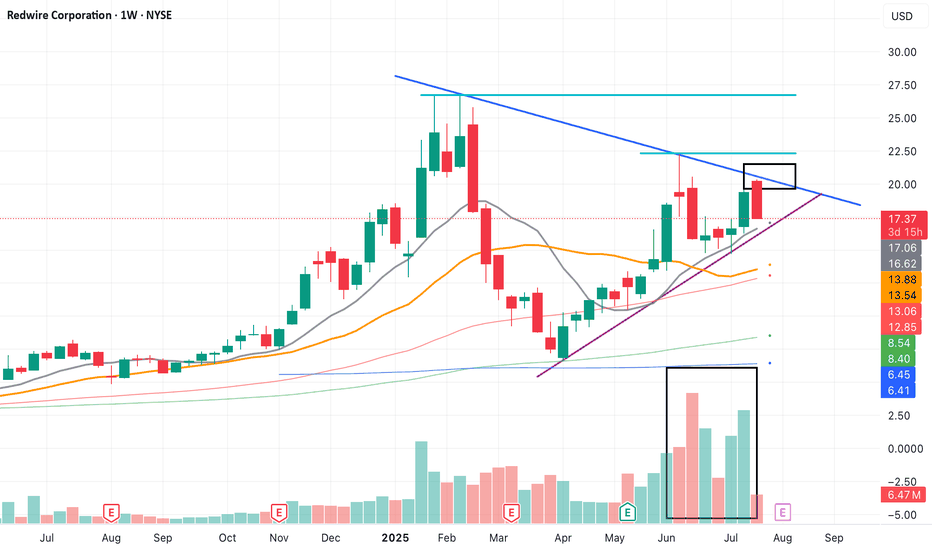
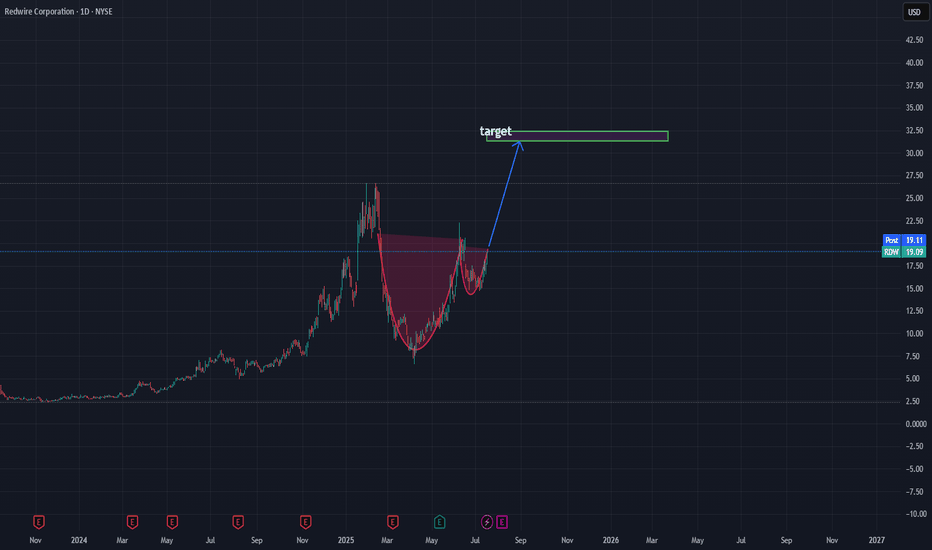
The price is approaching the purple support zone, where a partial entry could be considered while awaiting a bullish breakout of the blue resistance level.
If successful, the position can be increased.
For greater safety, one could wait for the breakout of the first light blue resistance level, where it may be possible to increase further.
Stop loss in case of a downward break of the purple support
RDW trade ideas
long for rdwlong NYSE:RDW
This content is for informational and educational purposes only and does not constitute financial, investment, or trading advice. I am not a licensed financial advisor. Any opinions, analyses, or forecasts are my own and are subject to change without notice. Always do your own research and consult with a qualified financial advisor before making any investment decisions. Trading involves risk, and you should only trade with capital you can afford to lose. Past performance is not indicative of future results.
ur welcome.
H3VL1N
$RDW new contract, technicals ready to launch Stock has been finding support on a meaningful volume shelf and got positive news about winning a critical new contract this morning. We're bouncing forcefully off the 200 and 20 SMA confluence area on the news and showing signs of improving price action The AVWAP pinch between the February 13th high and the April 7th low is getting very tight, and I believe it will resolve to the upside. As you can see from the volume profile, price has spent very little time between ~$13 and ~$20. We're starting to see animal spirits and a bid return to some of these futuristic new sub-sectors of the market like drones, quantum computing, modular nuclear reactors, and other space names, such at $RKLB...
Between the positive news gaining momentum and attention, the VWAP pinch getting very tight and suggesting a breakout of range soon, and the lack of volume/time spent immediately above this 13 level... I think NYSE:RDW could "rocket" towards 20 very soon.
I'd take my first tranch off around $16 and try to ride the rest towards $20, where I'd unload most if not all, depending on how the story/price develops.
RDW – 30-Min Long Trade Setup !📈🟢
🔹 Asset: Redwire Corporation (RDW – NYSE)
🔹 Timeframe: 30-Min Chart
🔹 Setup Type: Rising Wedge Breakout + Retest
📊 Trade Plan – Long Position
✅ Entry Zone: $10.16 (Breakout of wedge + key level reclaim)
✅ Stop-Loss (SL): $9.47 (Below structure & trendline support)
🎯 Take Profit Targets:
📌 TP1: $11.13 – Prior resistance area
📌 TP2: $12.19 – Strong supply zone
📐 Risk-Reward Calculation:
🟥 Risk: $0.69/share
🟩 Reward to TP2: $2.03/share
📊 R/R Ratio: ~1 : 2.9 – Attractive swing opportunity
🔍 Technical Highlights
📌 Breakout from rising wedge resistance ✔
📌 Tight consolidation just below yellow level before breakout ✔
📌 Multiple higher lows signaling bullish momentum ✔
📌 Volume pushing higher with breakout ✔
📉 Risk Management Strategy
🔁 Move SL to breakeven after TP1
💰 Book 50% profits at TP1
🚀 Let remaining ride toward TP2
🚨 Setup Invalidation If:
❌ Price closes below $9.47
❌ No continuation on volume breakout
❌ Rejection from $10.50–$11.00 range
🔗 Hashtags:
#RDW #BreakoutSetup #SwingTrading #NYSE #ProfittoPath #WedgePattern #ChartBreakout #SmartMoneyMove #RiskReward #TechnicalAnalysis
RDW – Redwire Corporation – 30-Min Long Trade Setup !:
📈 🚀
🔹 Asset: RDW (NYSE)
🔹 Timeframe: 30-Min Chart
🔹 Setup Type: Falling Wedge Breakout + Base Formation
📊 Trade Plan (Long Position)
✅ Entry Zone: Around $8.90 (wedge breakout + price base confirmation)
✅ Stop-Loss (SL): Below $8.40 (structure support & risk protection zone)
🎯 Take Profit Targets
📌 TP1: $9.37 (immediate resistance / consolidation zone)
📌 TP2: $10.17 (major resistance / recovery target)
📊 Risk-Reward Ratio Calculation
📉 Risk (SL Distance):
$8.90 - $8.40 = $0.50 risk per share
📈 Reward to TP1:
$9.37 - $8.90 = $0.47 → (0.94:1 R/R)
📈 Reward to TP2:
$10.17 - $8.90 = $1.27 → (2.54:1 R/R)
🔍 Technical Analysis & Strategy
📌 Falling Wedge Pattern: Tight consolidation with descending resistance broken
📌 Base Forming at Support: Price stabilizing above $8.40
📌 Breakout with Reaction: Bullish breakout confirmed by yellow zone retest
📌 Oversold Setup: Downtrend exhaustion with reversal potential
⚙️ Trade Execution & Risk Management
📊 Confirm bullish momentum after breakout close
📉 Trailing Stop Strategy:
Shift SL to breakeven after TP1 is hit
💰 Partial Profit Booking Strategy
✔ Book 50% at TP1 = $9.37
✔ Let the rest ride toward TP2 = $10.17
✔ Adjust SL to protect gains
⚠️ Breakout Failure Risk
❌ Setup invalidated if price breaks below $8.40
❌ Avoid chasing — wait for confirmation candle
🚀 Final Thoughts
✔ Classic falling wedge breakout after strong sell-off
✔ Defined structure with potential for trend reversal
✔ Attractive upside with 2.5:1 R/R on TP2
🔗 #RDW #NYSE #BreakoutTrade #ProfittoPath #SwingSetup #StockMarketMoves #TechnicalTrading #FallingWedge #BullishReversal #SmartTrading
Monday RDW Trade Setup!🚀 🚀
🔻 **Stop Loss (SL):** Below **16.51**
📈 **Entry:** Above **17.11**
🎯 **Target 1 (T1):** **17.74**
🎯 **Target 2 (T2):** **18.42**
💡 **Why Trade:**
Symmetrical triangle breakout with bullish continuation and volume supporting the move.
✅ **Conclusion:**
Prepare for Monday's breakout; monitor momentum and volume for confirmation. 💪📊
Redwire Corporation (RDW) AnalysisCompany Overview:
Redwire Corporation NYSE:RDW is a leading player in space infrastructure and advanced space technologies, driving innovation across multiple domains, including lunar exploration, in-space manufacturing, and solar power solutions. With a strong portfolio of high-profile contracts and cutting-edge capabilities, Redwire is well-positioned to capitalize on the growing space economy.
Key Developments:
NASA Lunar Gateway Contract:
Redwire secured a $100 million contract with NASA to develop solar arrays for the Lunar Gateway, a critical component of the Artemis program. This deal establishes a strong revenue base and reinforces Redwire’s role as a key partner in the advancement of lunar exploration.
Roll-Out Solar Array (ROSA):
The successful deployment of ROSA technology on the International Space Station (ISS) showcases Redwire’s engineering prowess. As demand for efficient and scalable space power solutions grows, ROSA positions Redwire to address increasing needs across satellite constellations and deep-space missions.
Strategic Acquisitions:
Redwire’s acquisition of QinetiQ Space NV, a European space infrastructure provider, expands its geographic footprint and diversifies its product offerings. This move enhances Redwire’s ability to serve international markets and strengthens its position as a global space technology leader.
In-Space Manufacturing Leadership:
Redwire’s participation in NASA’s OSAM-2 mission highlights its leadership in in-space manufacturing, an emerging and transformative capability that will enable the on-demand production and repair of spacecraft components in orbit.
Investment Outlook:
Bullish Outlook: We are bullish on RDW above the $9.50-$10.00 range, supported by its robust contract pipeline, proven technology, and strategic market expansion.
Upside Potential: Our price target is set at $20.00-$22.00, reflecting Redwire’s potential to grow its market share and capitalize on the increasing global investment in space infrastructure.
🚀 Redwire—Building the Future of Space! #SpaceInfrastructure #LunarExploration #InSpaceManufacturing
Redwire Poised to Benefit from Private Space Station DevelopmentAs NASA plans to decommission the International Space Station (ISS) with a special version of SpaceX's Dragon spacecraft, the focus shifts towards the burgeoning sector of private space stations. This transition marks a pivotal moment for the space industry, offering substantial opportunities for companies involved in space infrastructure.
Redwire Corporation, known for its diverse spacecraft components, stands to gain significantly from this new era. The company's expertise in designing and manufacturing key systems such as robotic greenhouses and large solar panels ideally positions it to supply the forthcoming private space stations.
Technical analysis of Redwire Corporation (NYSE: RDW)
Evaluating potential trading opportunities based on the technical setup of Redwire's stock:
Timeframe : Daily (D1)
Current trend : the stock is currently in a global uptrend, which began in mid-April 2024
Resistance level : 8.15 USD
Support level : 6.70 USD
Potential downtrend target : if a downtrend initiates, the downside target could be at 4.45 USD
Short-term target : if the uptrend continues and the resistance at 8.15 USD is breached, a short-term target could be set at 11.60 USD
Medium-term target : with sustained upward momentum, the stock price might aim for 13.75 USD
Investors and traders should closely monitor Redwire Corporation, especially given the growing interest in private space ventures. The company's role in supplying critical technology for space stations could significantly enhance its business prospects and impact its stock performance.
—
Ideas and other content presented on this page should not be considered as guidance for trading or an investment advice. RoboMarkets bears no responsibility for trading results based on trading opinions described in these analytical reviews.
The material presented and the information contained herein is for information purposes only and in no way should be considered as the provision of investment advice for the purposes of Investment Firms Law L. 87(I)/2017 of the Republic of Cyprus or any other form of personal advice or recommendation, which relates to certain types of transactions with certain types of financial instruments.
Risk Warning: CFDs are complex instruments and come with a high risk of losing money rapidly due to leverage. 65.68% of retail investor accounts lose money when trading CFDs with this provider. You should consider whether you understand how CFDs work and whether you can afford to take the high risk of losing your money.
Market Update - 7/28/2024• my equity curve is still close to all time lows
• lots of good setups in finance, healthcare, industrials and materials
• earnings season is in, could be the trigger for breakouts
• lots of pullback / base-on-base types of setups
• unfortunately I can't put 100% of my focus on trading right now for a few more weeks, so will likely keep missing opportunities


