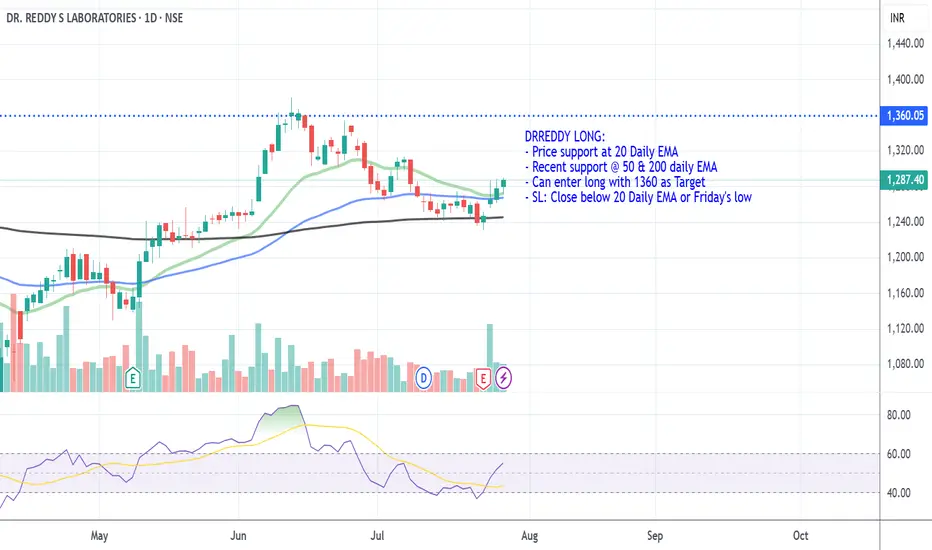
DRREDDY LONG_Support @ 20 DEMADRREDDY LONG:
- Price support at 20 Daily EMA
- Recent support @ 50 & 200 daily EMA
- Can enter long with 1360 as Target
- SL: Close below 20 Daily EMA or Friday's low
Next report date
—
Report period
—
EPS estimate
—
Revenue estimate
—
0.80 USD
668.79 M USD
3.85 B USD
832.31 M
About DR. REDDY S LABORATORIES
Sector
Industry
CEO
Erez Israeli
Website
Headquarters
Hyderabad
Founded
1984
FIGI
BBG000NJ96L6
Dr. Reddy's Laboratories Ltd. engages in the manufacture and marketing of pharmaceutical products. It operates through the following segments: Global Generics, Pharmaceutical Services and Active Ingredients, and Others. The Global Generics segment consists of manufacturing and marketing of prescription and over-the-counter finished pharmaceutical products ready for consumption by the patient, marketed under a brand name or as generic finished dosages with therapeutic equivalence to branded formulations. The Pharmaceutical Services and Active Ingredients segment focuses on manufacturing and marketing of active pharmaceutical ingredients and intermediates, also known as API, which are the principal ingredients for finished pharmaceutical products. The Others segment includes the operations of the subsidiary of the company. The company was founded by Kallam Anji Reddy on February 24, 1984 and is headquartered in Hyderabad, India.
Related stocks
Technical bounce back on cardsRevenue: ₹8,545 crore (~11% YoY increase)
Net Profit (PAT): ₹1,418 crore (~2% YoY growth)
North America generics revenue declined ~11% to ₹3,412 crore due to pricing pressures, while Europe surged 142% YoY
Consensus estimates (SimplyWall.st): Average target at ₹1,289, with bullish/bearish range ₹

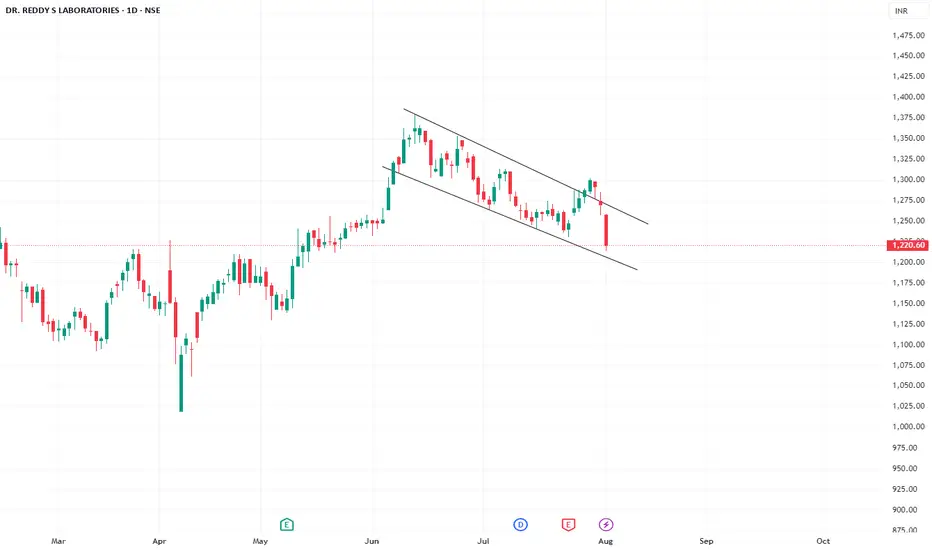
Dr Reddy on a falling wedge !!📊 DRREDDY – Falling Wedge Breakout Analysis
Date: August 2, 2025
CMP (Current Market Price): ₹1,220.60 ( Look for Support or breakdown on trend lines )
📝 Summary:
Dr. Reddy’s Laboratories has broken out of a falling wedge pattern on the daily chart, a classic bullish reversal setup. After weeks of
DRREDDY LONG_Support @ 20 Daily EMADRREDDY LONG:
- Price support at 20 Daily EMA
- Recent support @ 50 daily EmA
- Can enter long with 1360 as Target
- SL: Close below 20 Daily EMA or Friday's low

DRREDDY Short_Broke down from 20 DEMADRREDDY SHORT:
- Bearish Engulfing Candle
- Support broken 20 DEMA
- Price may retest 20 DEMA before going down (if its going down)
- Enter when the price is favorable in the lower timeframe
- Target: 50 DEMA

DRREDDY_Long_Bounce Back @ 20 Daily EMALooks Bullish.
Support near 20 DEMA
Bullish Engulfing Candle
Target 1360
SL Today's Low 1300
Enter when the Price makes Higher
low or tests the moving Avg

DR. REDDY Is becoming ready for downfallAfter proper price action formation DR. REDDY may fall sharply , my target for next 6 months to one year is 665, lets see what happens, but all this after only confirmation

DRREDDY🎯 Trade Setup Summary
Parameter Value
Trade Type BUY
Entry ₹1257
Stop Loss (SL) ₹1221
Risk ₹36
Target ₹1658
Reward ₹401
Risk-Reward (RR) 11.2
Last High ₹1421
Last Low ₹1020
🧠 Key Observations
Strong Bullish Confluence: All timeframes are in an UP trend, with demand zones stacking up across HTF, MTF

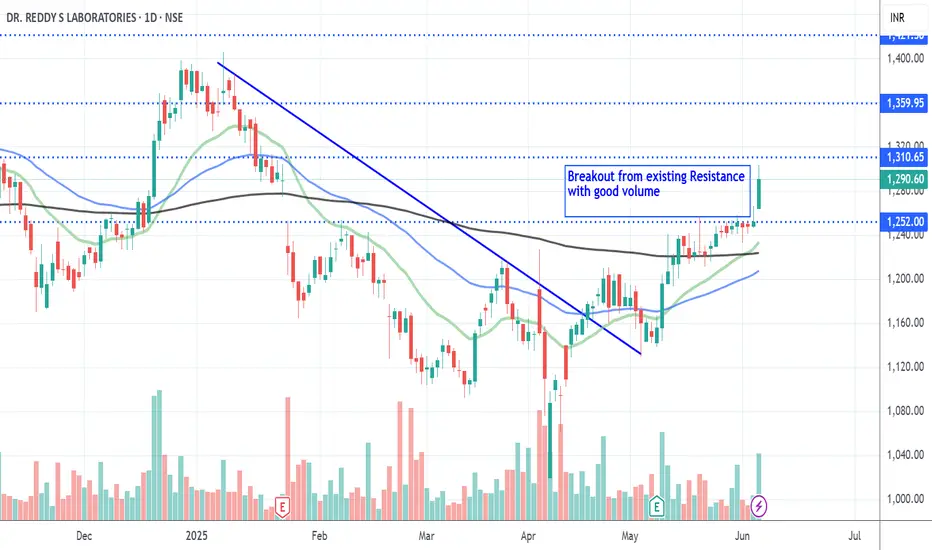
DRREDDY_LongBreakout from existing Resistance with good volume.
Wait till good entry point & Enter.
SL - Price close below 20 DEMA.
Disc: Educational Purpose only.
This chat is education purpose only.Dr. Reddy is ready to break out
Enter at CMP 1240 with SL of 1210
target is 1400.

See all ideas
Summarizing what the indicators are suggesting.
Neutral
SellBuy
Strong sellStrong buy
Strong sellSellNeutralBuyStrong buy
Neutral
SellBuy
Strong sellStrong buy
Strong sellSellNeutralBuyStrong buy
Neutral
SellBuy
Strong sellStrong buy
Strong sellSellNeutralBuyStrong buy
An aggregate view of professional's ratings.
Neutral
SellBuy
Strong sellStrong buy
Strong sellSellNeutralBuyStrong buy
Neutral
SellBuy
Strong sellStrong buy
Strong sellSellNeutralBuyStrong buy
Neutral
SellBuy
Strong sellStrong buy
Strong sellSellNeutralBuyStrong buy
Displays a symbol's price movements over previous years to identify recurring trends.