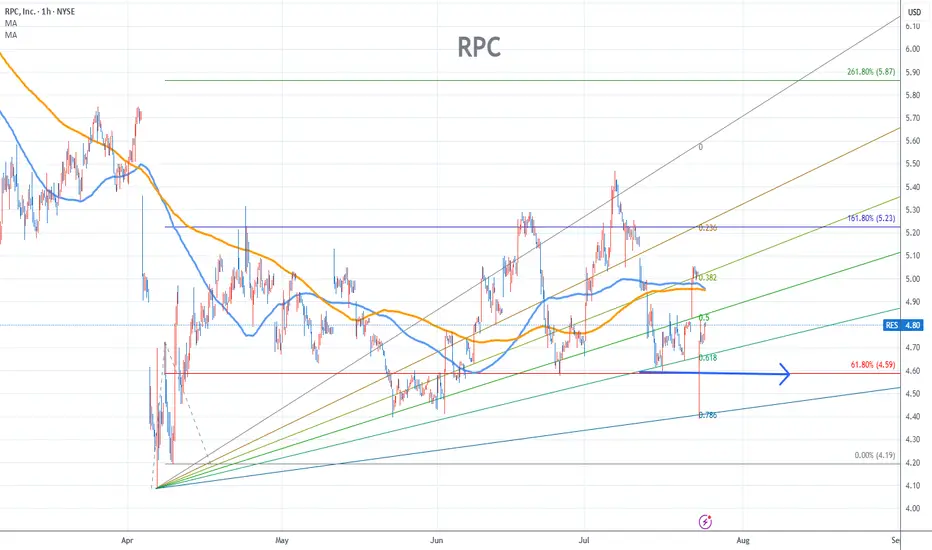
RPC Stock Chart Fibonacci Analysis 072425Trading Idea
1) Find a FIBO slingshot
2) Check FIBO 61.80% level
3) Entry Point > 4.6/61.80%
Chart time frame:B
A) 15 min(1W-3M)
B) 1 hr(3M-6M)
C) 4 hr(6M-1year)
D) 1 day(1-3years)
Stock progress:A
A) Keep rising over 61.80% resistance
B) 61.80% resistance
C) 61.80% support
D) Hit the bottom
E)
Next report date
—
Report period
—
EPS estimate
—
Revenue estimate
—
0.25 USD
89.90 M USD
1.41 B USD
97.43 M
About RPC, Inc.
Sector
Industry
CEO
Ben M. Palmer
Website
Headquarters
Atlanta
Founded
1984
FIGI
BBG000BS3047
RPC, Inc. engages in the exploration, production and development of oil and gas properties. It operates through the following segments: Technical Services and Support Services. The Technical Services segment provides oil and gas, fracturing, acidizing, coiled tubing, snubbing, nitrogen, well control, wireline and fishing services. The Support Services segment offers oilfield pipe inspection services and rental tools for use with onshore and offshore oil and gas well drilling. The company was founded in 1984 and is headquartered in Atlanta, GA.
Related stocks
RES neutral patternRES is inside the pennant which is a neutral pattern.
Our strategy is to wait for a breakout and then take a position.
Targets both for longs and shorts are shown on the chart.
Good luck.

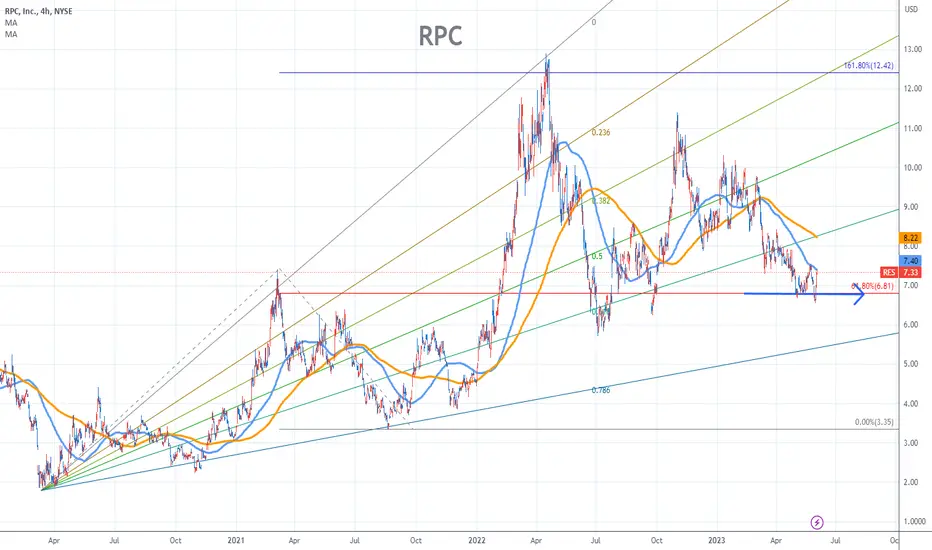
RPC Stock Chart Fibonacci Analysis 060423 Trading idea - Entry point > 6.8/61.80%
Chart time frame : C
A) 15 min(1W-3M)
B) 1 hr(3M-6M)
C) 4 hr(6M-1year)
D) 1 day(1-3years)
Stock progress : 1
A) Keep rising
B) Hit the bottom
C) Hit the top
Stocks rise as they rise from support and fall from resistance. Our goal is to find a low support
RESPossibly seeing a fake breakdown?
I entered long today and am interested in the volatility that gas/oil names have. Only in commons. Expect 13-14$

nice breakout 💸RES breaking past extreme resistance after the retest bounce. very bullish!
the next targets are 13.24-14.4

Don't be silly! 🎅Hi everyone, Yurii Domaranskyi here. Let's take a look at the chart:
1. Price levels are working pretty well!
2. globally down trend locally uptrend
3. the level confirmed by 2 false breakouts
4. distant test
5. approached with big bars
6. there was a sharp approach on m5
7. no rollback
8. from

Nice 3:1 trade on the daily chart with an uptrending stock.Price is trending upwards. It has been retracing up to the 70% Fib level for the last several swings. Go long when price takes support on the trend line near the $5.18 price point, stop loss near $3.68, and take profit near $10.25 at a strong resistance level as seen on the monthly chart.

3 Hr. "INVERSE HEAD & SHOULDERS" BULLISH
Classic Inverse Head & Shoulders bullish idea.
Enter long at green(you can enter at first green line or second green line), exit for loss at red or exit for gain orange lines(you can exit at either orange line).
DISCLAIMER:
I'M NOT A PROFESSIONAL TRADER AND THIS IS NOT A TRADING ADVICE.

RESMID-TERM: Bullish gartley AND bullish crab potentially double bottoming at the same PCZ level, which is a historical area. Daily classic bullish divergence on the RSI. (not financial advice)

RES: LongRES is in a multi-month rising channel.
Broke a smaller falling channel after testing the multi-month rising channel.
- Also broke through 50MA
In the next few days the price will test $5.36 resistance.
The price needs to flip the $5.36 resistance to support, if failed to flip price will likely rol

See all ideas
Summarizing what the indicators are suggesting.
Neutral
SellBuy
Strong sellStrong buy
Strong sellSellNeutralBuyStrong buy
Neutral
SellBuy
Strong sellStrong buy
Strong sellSellNeutralBuyStrong buy
Neutral
SellBuy
Strong sellStrong buy
Strong sellSellNeutralBuyStrong buy
An aggregate view of professional's ratings.
Neutral
SellBuy
Strong sellStrong buy
Strong sellSellNeutralBuyStrong buy
Neutral
SellBuy
Strong sellStrong buy
Strong sellSellNeutralBuyStrong buy
Neutral
SellBuy
Strong sellStrong buy
Strong sellSellNeutralBuyStrong buy
Displays a symbol's price movements over previous years to identify recurring trends.
Frequently Asked Questions
The current price of RES is 4.47 USD — it has decreased by −3.87% in the past 24 hours. Watch RPC, Inc. stock price performance more closely on the chart.
Depending on the exchange, the stock ticker may vary. For instance, on NYSE exchange RPC, Inc. stocks are traded under the ticker RES.
RES stock has fallen by −6.88% compared to the previous week, the month change is a −10.78% fall, over the last year RPC, Inc. has showed a −39.92% decrease.
We've gathered analysts' opinions on RPC, Inc. future price: according to them, RES price has a max estimate of 8.00 USD and a min estimate of 4.75 USD. Watch RES chart and read a more detailed RPC, Inc. stock forecast: see what analysts think of RPC, Inc. and suggest that you do with its stocks.
RES stock is 5.44% volatile and has beta coefficient of 1.32. Track RPC, Inc. stock price on the chart and check out the list of the most volatile stocks — is RPC, Inc. there?
Today RPC, Inc. has the market capitalization of 986.16 M, it has decreased by −10.58% over the last week.
Yes, you can track RPC, Inc. financials in yearly and quarterly reports right on TradingView.
RPC, Inc. is going to release the next earnings report on Oct 22, 2025. Keep track of upcoming events with our Earnings Calendar.
RES earnings for the last quarter are 0.08 USD per share, whereas the estimation was 0.09 USD resulting in a −8.82% surprise. The estimated earnings for the next quarter are 0.07 USD per share. See more details about RPC, Inc. earnings.
RPC, Inc. revenue for the last quarter amounts to 420.81 M USD, despite the estimated figure of 420.50 M USD. In the next quarter, revenue is expected to reach 410.37 M USD.
RES net income for the last quarter is 10.13 M USD, while the quarter before that showed 11.82 M USD of net income which accounts for −14.30% change. Track more RPC, Inc. financial stats to get the full picture.
Yes, RES dividends are paid quarterly. The last dividend per share was 0.04 USD. As of today, Dividend Yield (TTM)% is 3.58%. Tracking RPC, Inc. dividends might help you take more informed decisions.
RPC, Inc. dividend yield was 2.69% in 2024, and payout ratio reached 37.62%. The year before the numbers were 2.20% and 17.74% correspondingly. See high-dividend stocks and find more opportunities for your portfolio.
As of Aug 2, 2025, the company has 2.6 K employees. See our rating of the largest employees — is RPC, Inc. on this list?
EBITDA measures a company's operating performance, its growth signifies an improvement in the efficiency of a company. RPC, Inc. EBITDA is 205.73 M USD, and current EBITDA margin is 15.68%. See more stats in RPC, Inc. financial statements.
Like other stocks, RES shares are traded on stock exchanges, e.g. Nasdaq, Nyse, Euronext, and the easiest way to buy them is through an online stock broker. To do this, you need to open an account and follow a broker's procedures, then start trading. You can trade RPC, Inc. stock right from TradingView charts — choose your broker and connect to your account.
Investing in stocks requires a comprehensive research: you should carefully study all the available data, e.g. company's financials, related news, and its technical analysis. So RPC, Inc. technincal analysis shows the strong sell today, and its 1 week rating is sell. Since market conditions are prone to changes, it's worth looking a bit further into the future — according to the 1 month rating RPC, Inc. stock shows the sell signal. See more of RPC, Inc. technicals for a more comprehensive analysis.
If you're still not sure, try looking for inspiration in our curated watchlists.
If you're still not sure, try looking for inspiration in our curated watchlists.