RF -- Nice channel pattern seen on 3min and 15min charting!!!RF -- REGIONS FINANCIAL CORP --- Nice channel pattern seen on 3min and 15min charting!!! ----- Since the BUY on Jan 31 / begin of Feb --- it has moved up nicely in a distinct pattern to watch for.... See if it continues upward......
Use Stop Loss and take pofits as you may wish on DD...on any stock. Thank you for the upvotes!
Disclaimer:
Always do your own due diligence, full research, and homework, and consult with your own licensed investment professional before any investments. Any comments and analysis seen here are personal opinions, and we are not registered or licensed in any jurisdiction whatsoever to provide any investing advice. Any analysis, charting and comments should never be used for the purposes of assisting in any advisory decisions with any stock purchase or sale, and never to be used on the basis of making any kind of investment decisions. It is for the sole purposes of opinions and thoughts only of the markets. Thank you.
RF trade ideas

RF -- Nice movement this AM.RF -- Nice movement this AM. looking fine... for now. Lets see...
Disclaimer:
Always do your own due diligence, full research, and homework, and consult with your own licensed investment professional before any investments. Any comments and analysis seen here are personal opinions, and we are not registered or licensed in any jurisdiction whatsoever to provide any investing advice. Any analysis, charting and comments should never be used for the purposes of assisting in any advisory decisions with any stock purchase or sale, and never to be used on the basis of making any kind of investment decisions. It is for the sole purposes of entertainment use only. Thank you.

RF - Regions Financial CORP? turning corner?RF - Regions Financial CORP
May be turning corner possibly now....
as it may have reached some support on the lower end of a channel. There should be soem support for ▲ (15.65% Upside potential) . Based on 16 analysts offering 12 month price targets for Regions Financial in the last 3 months. The average price target is $18.40 with a high forecast of $21.00 and a low forecast of $17.00. The average price target represents a 15.65% increase from the last price of $15.91.
Disclaimer:
Always do your own due diligence, full research, and homework, and consult with your own licensed investment professional before any investments. Any comments and analysis seen here are personal opinions, and we are not registered or licensed in any jurisdiction whatsoever to provide any investing advice. Any analysis, charting and comments should never be used for the purposes of assisting in any advisory decisions with any stock purchase or sale, and never to be used on the basis of making any kind of investment decisions. It is for the sole purposes of entertainment use only. Thank you.


RF above long-term trendlineRF broke a long-term trendline, which bodes well for the likelihood of an upward breakout by the stock.
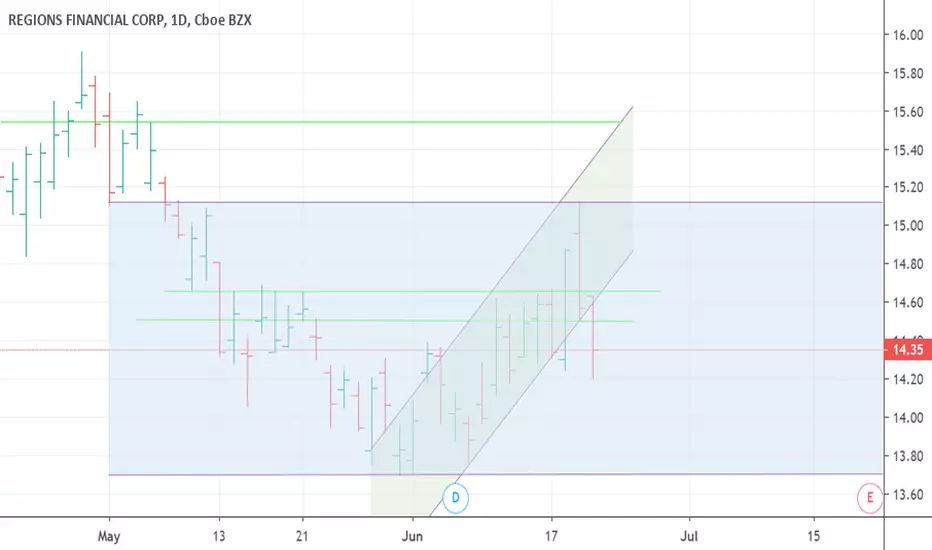
RF downward channel breakoutI've liquidated my long position in Regions Financial after this morning's downward channel breach. RF is still in its horizontal channel, so in the medium term this stock is looking neutral. In the short term, it may head to channel bottom.
Regions Financial Corp. Announces Share Repurchase Program Up ToRF: Regions Financial Corporation
2019-06-27 16:42:00
Regions Financial Corp. Announces Share Repurchase Program Up To $1.37 Billion - Business Wire
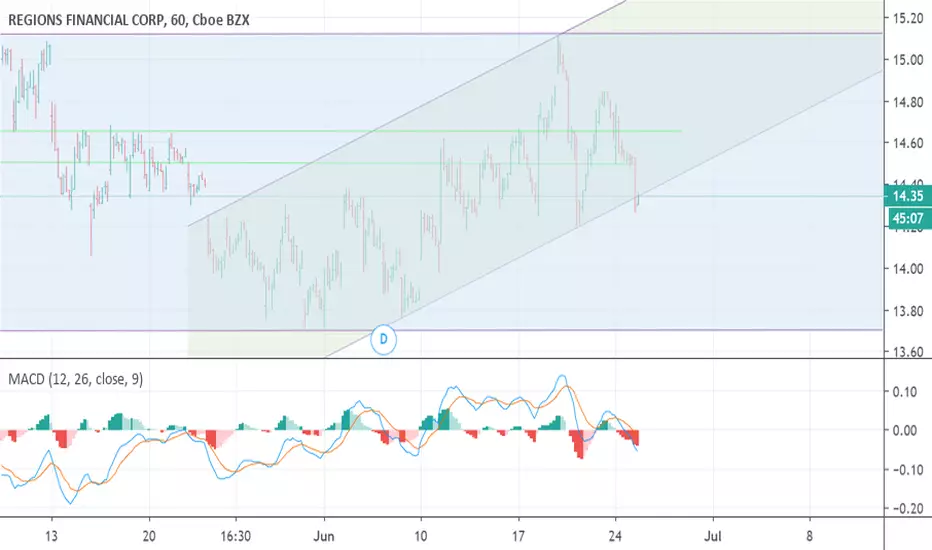
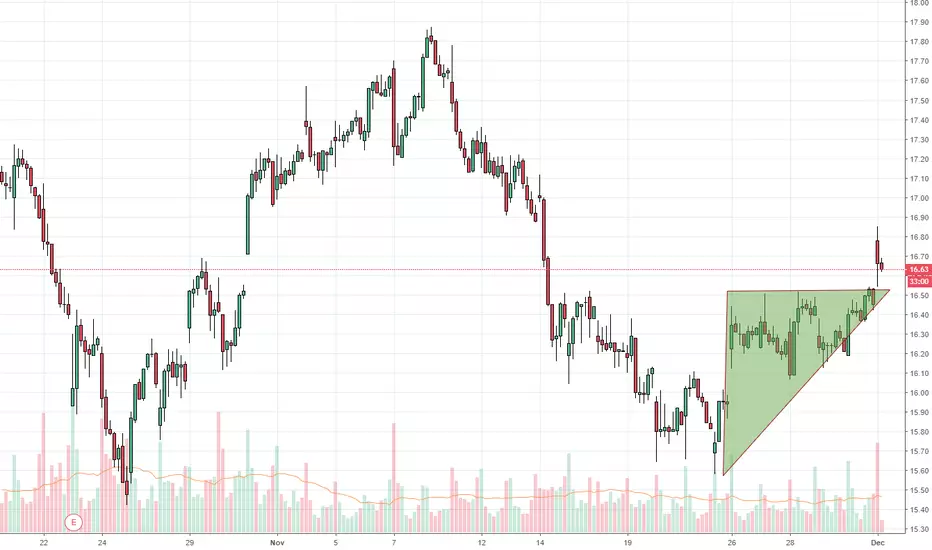
Regions Financial looking bullish in adjusted channelI've been closely watching Regions Financial. Originally I charted a steeper upward channel for this stock, but after today's moves I've adjusted my chart and am feeling a lot more confident about the pattern here. The question now is whether it will ultimately follow the horizontal channel or the upward-sloping one. Look for about 15.10 before it comes to a decision point.

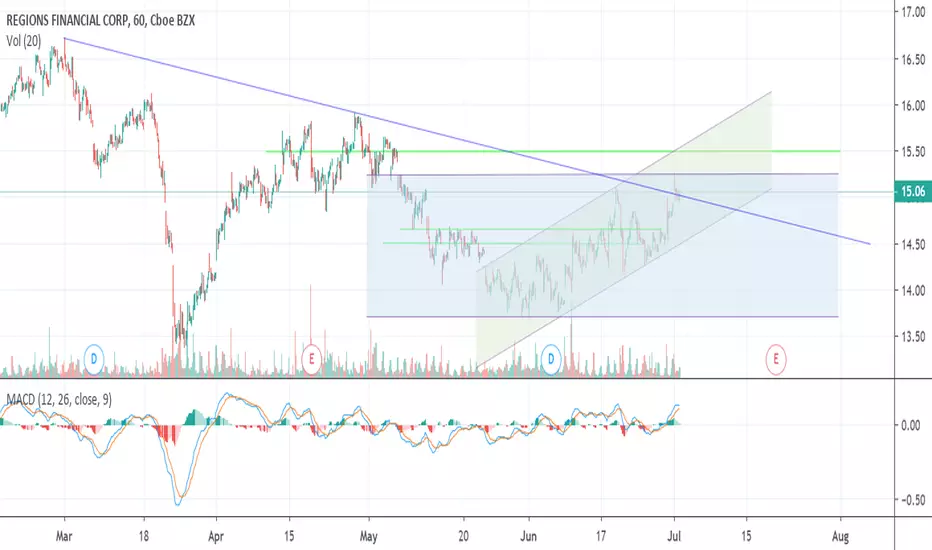
RF head and shoulders or double bottom?RF broke out of its upward-sloping parallel channel after the Fed's hint that it may cut rates in July. Rate cuts are generally bearish for banking stocks.
RF is now in a horizontal parallel channel. Analysts remain bullish, so I still suspect it will break upward out of the channel ahead of July 19 earnings. If it holds at the current high-volume support above 14.32, it may make a head-and-shoulders chart pattern. Otherwise look for a double bottom.
On downward channel breakout below 13.70, RF is bearish. On upward channel breakout above 15.12, we have a confirmed double bottom.
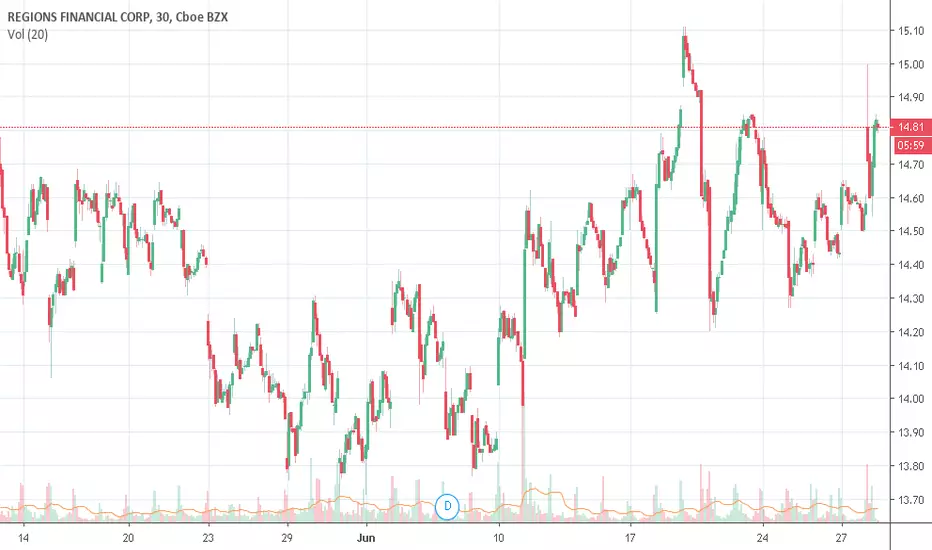
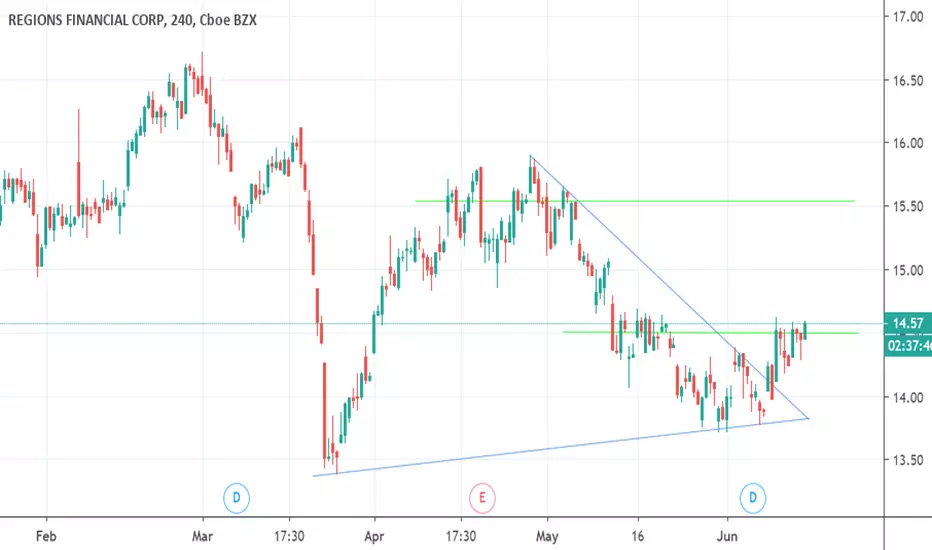
$1.00 per share upside in Regions Financial?Regions Financial (RF) recently broke out of the top side of a triangle and appears to be working its way through all the sellers in the $14.50-$14.60 resistance range today. From there, the coast is fairly clear up to about $15.50. Analyst ratings are mostly bullish on the stock.

RF, a sellThe stock recently fell below the uptrend, which is bearish. With price currently trading below all of its EMAs, prices could potentially breach below the neck line of the double tops pattern.
MACD has moved into negative territory

RF still in downtrendWhile the balance sheet of NYSE:RF is a bit negative YOY, the net sales and dividend per share increased YOY, along with increasing profitability on the income statement, this is a buy long term. Price targets between $17 - $24, could retrace to fill price gap near $16 then move upwards to more attractive price per share.

Morning star reversal weeklyMy thoughts: at support and waiting for MSR on weekly candle to be bullish.

Bullish Marabozu Following Inverse H&SOscillators and indicators supporting raising price after positive earnings last month.

One of my favortie breakoutsRetesting 50dma creating an accumulation shelve box, ready to breakout to the upside no to much to explain here folks. wait for volume confirmation.


$rf downtrend breakout lookout!-long term time frame is almost completing a symmetrical triangle and price bounced off support
-intermediate time frame shows break of downtrend line and price action shows the impulse moves being weaker as it continued its downtrend showing possibility of tiring out
-also price rejection at the 13.26 area showing support on higher and intermediate timeframe and started to make higher highs/
-looking to make and entry on this breakout on the intermediate time frame for a breakout out of the symmetrical triangle on the higher timeframe above 14.0x area
-looking for a move back to the .50 retracement level of 14.0x which coincide with the higher time and will be watching out for the breakout
-positive divergences on rsi and macd are confluences

RF to $16Indicators have reset and turning back up for a run to $16 IMO. 50 MDA only thing in the way, however 9/20/50 should be aligned soon for blast-off. Demarker in MOMO territory with WT_LB / ADX bullish. Squeeze should release soon.

longI like the stock because there is a nice breakout of a big descending triangle so this is strong. ( Yeah the stock did not totally broke the trendline and this is why i putt my entry above that trendline to make sure that the trend is very broking out of that trendline).
The candle today was very strong, open nears i low and close at his high shows the strenght of that candle and the buying pressure there is so im expecting a move on the upside.
As you can see also the stock did broke a tight range of a little symmetrical triangle so this is also good sign for a move on the upside.
The stock not only broke that tight range it also broke the EMA 10 and 20 so i would no be suprise if we see a move on the upside over the next week , this is why im bullish on the stock.
