Waiting for the Santander bounceSetup identified by algorithm.
Entries
Stoploss
Targets
All set, now we wait.
SAN trade ideas

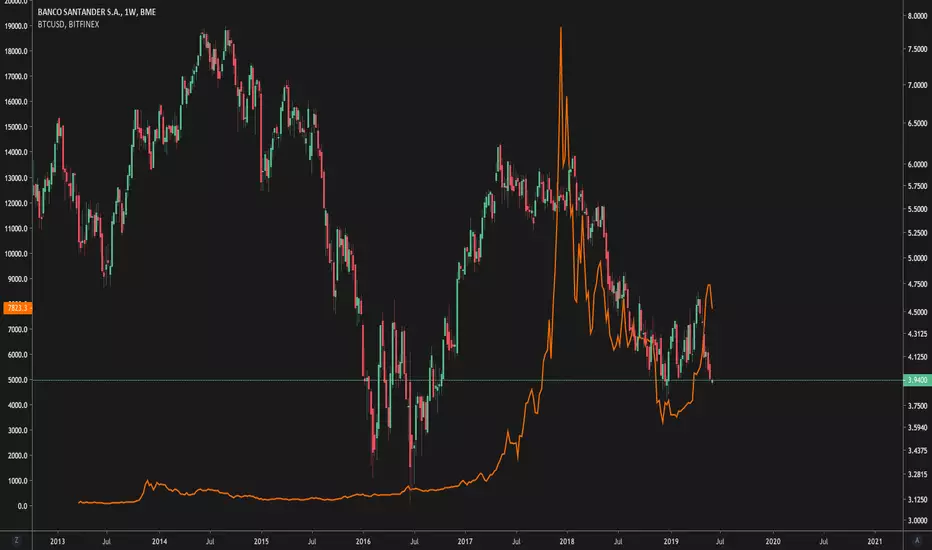
Santander representative till now of European Banking miseryEuropean banks have been much maligned and languishing for years.
Some banks have been trading at yields of close to 6 per cent (UBS and BNP are good examples.)
Despite the bad news and continued QE, banks in Europe even Deutsche seem to be forming long term bases.
The bases seem to be rounding bottoms and despite the fact that I am not bullish in general the following look as though they may be long term buys with potential to double in the next years.
Banco Santander
BNP Paribas
UBS Group


Santander Long Position Santander, good opportunity to enter in a long position, it´s near de anual support of 3.8, then it rise to 4.40 near and make a retracement to 4.05€ to the level 61 of Fibbonacci and after bad news so it´s a goood oportunity to enter long, maybe can have a continuation on the dowtrend but it´s in a good price for long swing.


I like it :)Bounced at the 0.786
The fundamentals of this bank are really strong.
If Italy doesn't crash, Santander is a clear long hold.

Banco Santander 5 RRR shortReposting this since TV removed this idea earlier for containing links to my telegram group.
Trading Methodology:
1. An asymmetric bullish/bearish pennant is drawn using ascending and descending curved trend lines with a minimum of three price action touche points per line. The direction is determined by the previous trend.
2. The angle tool is applied from the earliest two trend touch points, beginning at the earliest touch point.
3. A trend-based Fibonacci retracement triangle is drawn starting from the earliest trend touch point and ending at the earliest touch point of the opposite trend line .
4. Based on the degree, of the earlier defined angle, the appropriate (and secret) levels are selected for the fibonacci retracement ; two levels for stop-loss and two levels for take-profit. The closest stop-loss level to the current price level is the top priority stop-loss. Though the secondary stop-loss level is often chosen for some markets such as FX and some equities in order to account for seldom unexpected resistance breaks. The greater target level is the top priority, and where majority of the shares are sold, though some may choose to close part of the position at the first target level or set it to be the stop-loss once price exceeds it. Entries should be laddered in around the levels closest of the yellow line.
This trading strategy can be applied to any market and time frame, and positions most often garner the greatest risk-to-reward ratio with the highest success rate. What more can you ask for? I will only be posting my unique trading strategy until EOY. I work solely with price action to identify pennants and apply unique trend-based fibonacci retracement levels for SL and TP levels. Reach out to me if you have any questions.


Banco Santana: Ending DiagonalBanco Santana looks to be completing the final wave of the ending diagonal, there could be possible a trade to the downside although be careful because the E wave doesn't always move down to the trend line. When it does we will be looking for trades to the upside and letting the trade ride.
Thanks

CORRECTIVE STRUCTURE in SANTANDER - Daily ChartHey Traders,
Another good opportunity in the Spanish Stocks. Looking for these moves in Santander Bank. Check last analysis I did in 2016 here on TV. It is attached :)
-
Hola Traders,
Otra oportunidad en Valores Españoles. Buscando estos movimientos en e Banco Santander. Chequead mi último análisis de TV en 2016. Esta aquí adjunto :)
Carlos

BANCO SANTANDER SAN value per share is currently being traded at $6.52 per stock. Monthly high was December 3rd 2007 being at $22.34 per stock. Price level of $4.89 per stock has been a major level since is has been a strong support area. I could expect price to fall $1.63 per stock to $4.89 per stock then retrace back up to the $10.75 per stock since that would be the closest major high and much consolidation.

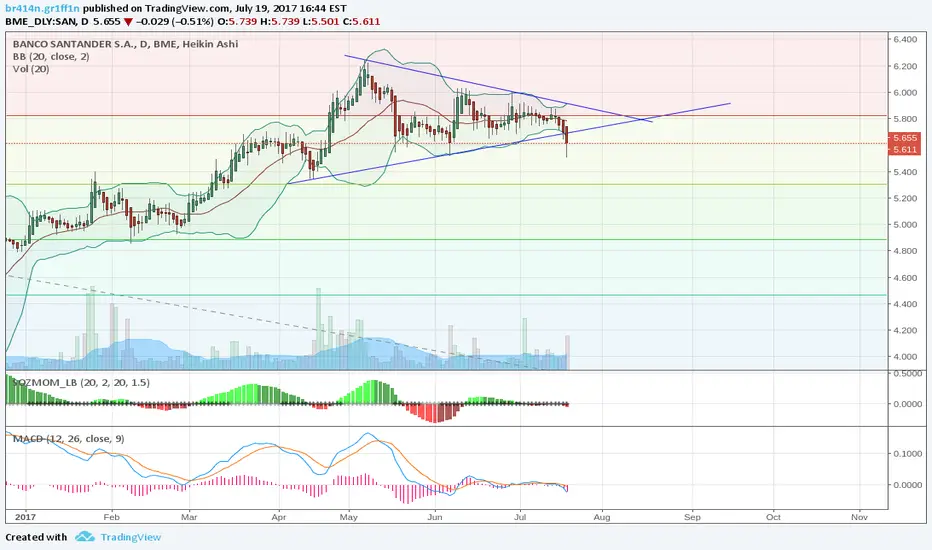
Possible ascending triangle with RSI bullish divergenceSantander's price has been on clear decrease from May's 2017 all time high, but it's showing some stabilisation or loss of interest in a symmetrical triangle, ever so slightly ascending. The Stochastic RSI is showing what could be a bullish divergence. If the price breaks the 5.90 resistance it would signal a change of trend. Otherwise, the 5.80 price area could be a good place to take benefits.

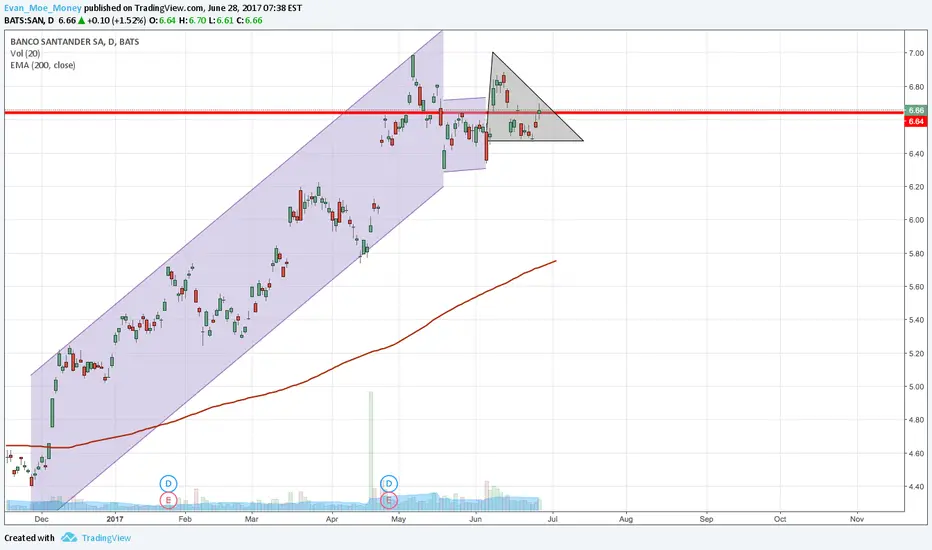
Waiting for the breakoutI guess we will have a long breakout, since the EMA 200 ist below price. keep this one in mind!
tell me what u think as well, since I'm new on tradingveiw thx


$BNC - Banco Santander (LSE) - BuyLooking at a buy on BNC if we see a break of todays high. A huge amount of volume at this supply zone so looking to take price to 500 in the short term.
This zone also coincides with the 50MA. We could see a test of 440 if price decides to take a dive, if it does I will look to enter at the 440 area at the 100ma and ascending trend line.

SAN - going up?SAN gapped up yesterday, on high volume. It is likely it will spike up this morning. In case it will drop to around $6.31, it may be a good buy, while choosing a positive risk/reward.
