SDRL trade ideas

Seadrill [SDRL]Stock went down from very high price to $1.57. Consolidation in progress.
This chart show that a good company can have a bad stock... I think this is a corrective movement after hit the $1.57 ATL
Flat to the upside... so, I do give a bigger probability to the ABC correction rather than impusle wave.
This is a daily chart but count based on weekly. Let's see how it will develop...

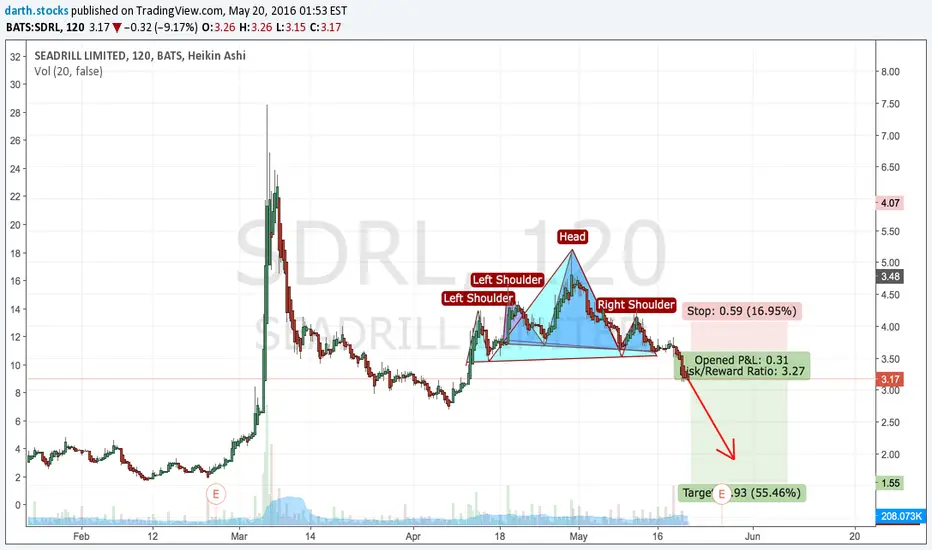
Seadrill: "This Time It's Different"I know you keep smiling when you hear that phrase... We have a nice Cup&Handle Formation of Seadrill targeting 3.90. Different to the October Peak, higher prices are not yet used to sell (maybe will come). So, depending on Crude development in the next few days we may see a similar short squeeze as beginning of the year... But it seems Sentiment for Offshore Drillers has changed, so keep an eye on them.

SDRL and Offshore Oil: LongI think it should be self explanatory... Expected a short squeeze already in Sep/Oct, but it seems to start now. Regular Target: 3.70 Region. On Short Squeeze: above 7.50


Less than the book value, cheap price. In a Huge demand zone, less than the book value. Perfect buying price

Seadrill: Still time to buy20% of Seadrill Shares are short ...! That's a whole lot and now it starts to be quite dangerous for short sellers. At about 3.05 - 3.10 the first wave should start ... I would guess.

SEADRILL Limited LONGPossible buy position on seadrill limited when the price go back and rsi 2 lower than 50

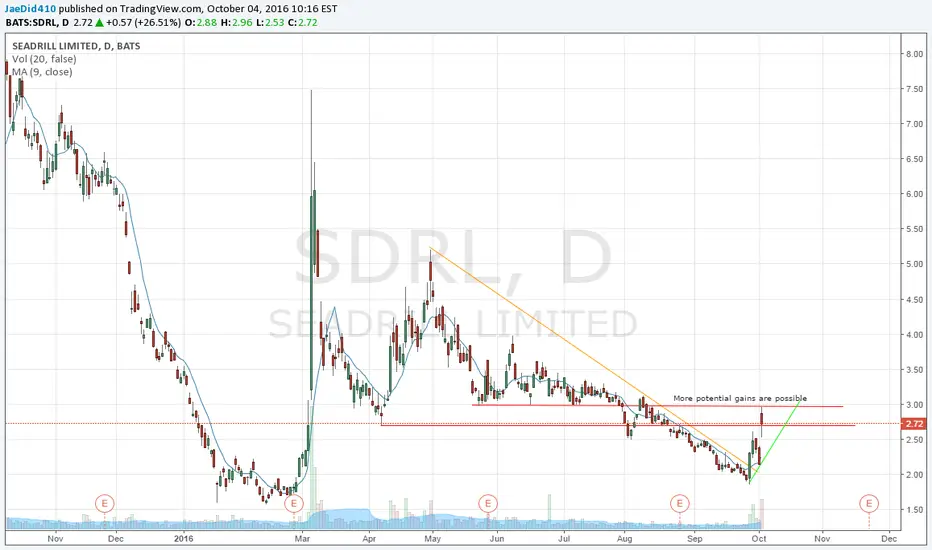
JaeSmith - Trading Perspective - SDRLA definite reversal has occured, it has room for a pull back, facing resistance between 2.71 and 2.96. If the 2.96 is even tested let alone breaks through then this should be fun to watch.
Offshore Drillers: Performance gaps will be closedCompared to Brent the whole Offshore Drilling Industry had a miserable "recovery"... Presenting here Seadrill Group in comparison with Brent shows the upward target and the fair value would be around 24 (currently 9). From the chart the correction target from the rising wedge was hit almost on point and we should expect a reasonable upward movement. Remember: Fair current Value would be in 24 Range...

Seadrill: short squeeze imminentAfter having reached my target of 1.92 the recent OPEC production cut will lead to a extremer short covering compared to March. Volume is SURGING! If non OPEC members confirm production cuts we will see SDRL soon above 12-15...

SDRL long ideaWill be watching price this morning for a potential breakout of the current bull pennant.
Bull's favor:
1. Large buying volume recently
2. Golden cross formed yesterday
3. MACD near a bullish crossover
4. Medium-term trend is currently with us
5. Bull pole/Pennant pattern currently (15 Min)
Bear's favor:
1. Negative divergence in MFI and RSI created recently
2. A few resistance levels waiting up ahead
3. 200-period SMA still neutral
If price can break current pattern this morning to the upside, we could see some healthy movement and some work towards those resistances.

First Idea, my chart practices. SDRL long idea.I am thinking about paper trading a long position around this price point (2.97 area) based off a few factors.
1. Positive MFI divergence relative to recent price action
2. MACD nearing a bullish zero-line crossover
3. Of the opinion oil will be bouncing soon, SDRL should follow accordingly
A few resistance points up ahead that will need to be broken through, and a key level of support around $2.90 if it moves downwards. Also in overall downwards trend, so not currently considering an extensive long position here.
Again I am only paper trading this, and this is my first idea here. Working hard in my trading studies & aiming for big improvements over time.

#SDRL:Opportunity To Buy!SDRL had a downtrend to support and formed a rounded bottom at support now seeing bulls buying in so this is a good set up to look for longs this week.
For more information in joining my professional signals group or professional online trading tuition, Message me directly on Trading view or email me with the email address on my Trading view profile page
Twitter: Tomkillick1
Email: T.killick182@gmail.com
Skype: Tom.killick182


Buying Time & Hanging on it's LifebuoyBullish Short-Term, Trade Cautiously: This post will come in two parts. The first I will explain the most recent trade I exited yesterday, 05/11/16 using technical analysis from the information provided the day prior; and secondly I will review the fundamentals of the company and speculate the short-term outlook into the next two crucial months that lays ahead.
The Setup:
Lets start off with Support and Resistance levels. I set resistance at a previous high of $4.36-4.38, take notice of multi-tops on open May 3, 4 5. I figure, retracing back to this testing point will be my gain. Support levels established on May 9th. This day is critical for the setup. The 9th opened on new lows and tested a support level from April 19th and 26th at roughly the $3.70-$3.75 mark. 10:30 AM to 11:00 AM on the 9th was rough on the Bulls, and Bears had all to gain. Tier 1 Support level established here at $3.75 Later on in the day on the 9th, downward momentum death-dropped the price to $3.54, thus I established this as Tier 2 Support of $3.55 when it began retracing to neutral territory. Overall, despite the 9th performing badly, it signaled trend reversal and began plotting the trend-lines.
Initially, I thought the overall trend is just going to be an ascending triangle waiting for the resistance breakout. On 05/05/16 it broke the dashed blue long term trend-line. (Yellow Circle) No hope. Bearish Elliot-Wave? Nope. So, then maybe perhaps it is an expanding triangle pattern? (Resistance & Solid Blue Downtrend). Kind of... Upon further inspection it was so simplistic I missed it. Ascending wedge and expanding triangle combo. Reverse pennant/flag pattern. The volume is decreasing on each gap day, the sellers are in control and a significant portion of S/RSI is over-bought.
At 3:45 P.M. on 05/11/16 I entered at $3.95. I followed the sellers (sharp drop in S/RSI in power-hour) and I expected overnight to gap-down and boost on the ascending wedge. This is inherently risky because I knew I had to dump quickly in the morning. Stop-loss of 0.12 cents per share. I wanted 0.19 to 0.20 cents per share . Optimistic target of 0.40 cents. Hey! You can always dream. I overslept pre-market. My auto-alert started to exit my shares at $4.11. I had one block exit at $4.15. I missed top, but lucky did not stick around to eat dirt afterwards.
Short-Term Prospectus: - Paraphrasing from Motley Fool + My own thoughts.
Tread cautiously. This past Tuesday, 05/10, U.S. equities had their biggest gains in two months after the Chinese government cut interest rates to boosts it's economy. All industrial sectors of the S&P 500 closed higher, with some of the biggest gains in energy. FX:USOIL & FX:UKOIL prices are holding steady. In addition to news stories, I would also speculate that the fire in Fort McMurray creates a short term oil production shortage and increased demand in the Americas. Last year or a few years ago if I recall, the company launched its newest fleet of drilling vessels that are top of the line in cutting edge technology compared to other offshore drilling companies.
On the Flip-side: According to John Persinos ,
"The analyst consensus is that Seadrill's adjusted earnings per share will come in at 39 cents, compared with 71 cents in the same quarter a year ago. Adjusted E.P.S for the next quarter is pegged at 38 cents, compared with 79 cents in the year-earlier quarter all of 2016, E.P.S is projected to reach $1.30, compared with $2.27 in 2015."
Terrible projections for earnings growth. The company also has debt-to-equity ratio of 1.17, tallying nearly $11.1 Billion of interest bearing debt, $8.3 billion of which is secured largely by liens on drilling vessels. Lucky, it has recently negotiated a deal to refinance it's debt.

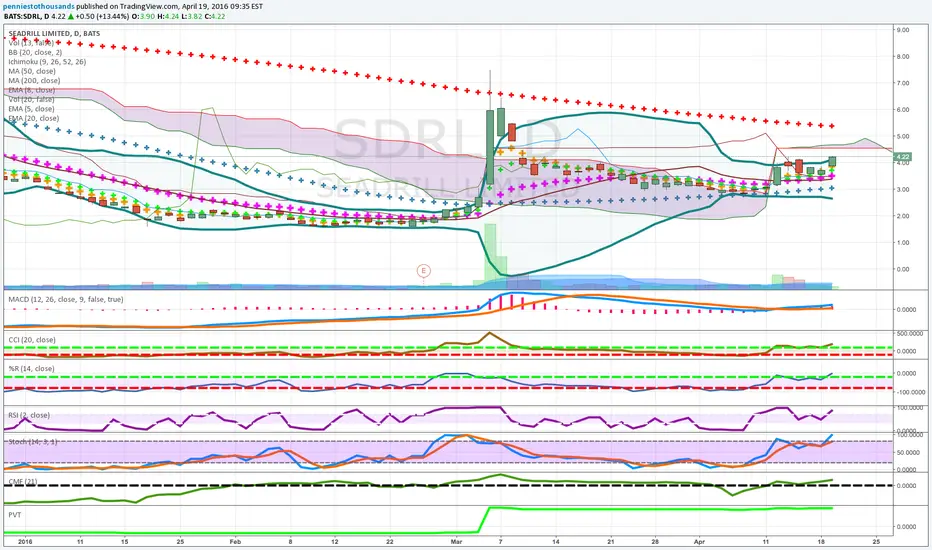
pennies to thousands candidate second time in 2 months thin cldran before see our book on amazon on entering and when to exit- -thin cloud-stoc and mac good-cci and oercent r range above -above 50--price volume strong-money flow good-

SDRL.....:-) please take a look at there fleet status :-) woah! I just posted a blank chart to show my view for now. what happened to the dry shipping industry could be happening now. to very very very badly positioned drillers. no question oil is still (black gold) in a sense. but.. my view. fund it all you want fooldreksen.....

SDRL BEARISH EOD TRIGGER?HAVE A TRIGGER SET ON SDRL IF WE CLOSE BELOW 2.88, WOULD BE LOOKING TO SHORT
