SJM to $110My trading plan is very simple.
I buy or sell when price tags the top or bottom of parallel channels.
I confirm when price hits Fibonacci levels.
So...
Here's why I'm picking this symbol to do the thing.
Price at bottom of channels (period 100 52 39 & 26)
Stochastic Momentum Index (SMI) at oversold level
VBSM is spiked negative and below Bollinger Band
Entry at $104.75
Target is $110 or channel top
SJM trade ideas

SJM The J. M. Smucker Company Options Ahead of EarningsAnalyzing the options chain and the chart patterns of SJM The J. M. Smucker Company prior to the earnings report this week,
I would consider purchasing the 140usd strike price in the money Calls with
an expiration date of 2023-9-15,
for a premium of approximately $4.60.
If these options prove to be profitable prior to the earnings release, I would sell at least half of them.
Looking forward to read your opinion about it.


$SJM with a Bullish outlook following its earnings #Stocks The PEAD projected a Bullish outlook for $SJM after a Negative over reaction following its earnings release placing the stock in drift C with an expected accuracy of 66.67%.

QuickTrade n. 56 : SJMLong : Looking for a positive test of the fast 21h/50h on the 250h
Short : Looking for a bearish cross

$SJM with a Neutral outlook following its earnings #Stocks The PEAD projected a Neutral outlook for $SJM after a Negative over reaction following its earnings release placing the stock in drift C with an expected accuracy of 75%.

$SJM with a Neutral outlook following its earnings #Stocks The PEAD projected a Neutral outlook for $SJM after a Negative over reaction following its earnings release placing the stock in drift C with an expected accuracy of 71.43%.

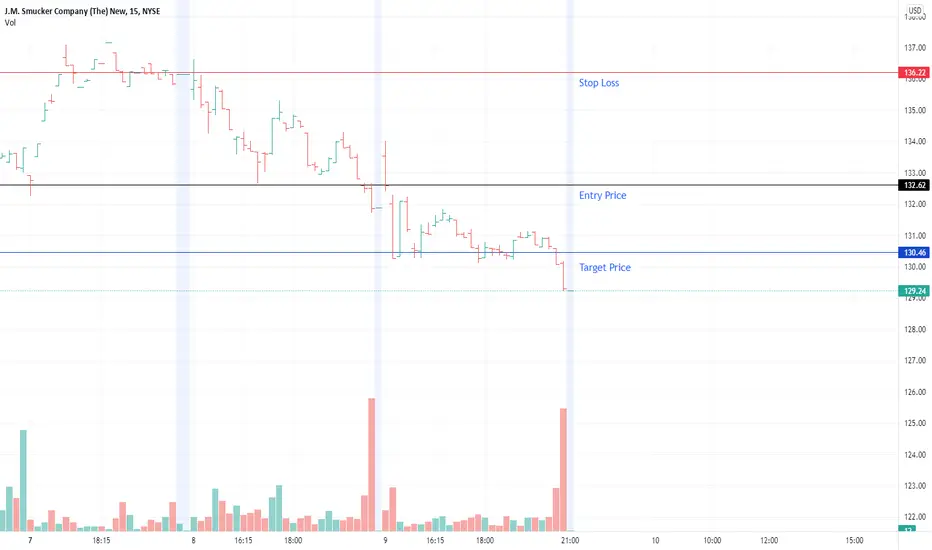
10/3/2022 NYSE (SJM)Short (Entry Price) below the black line and exit (Stop Loss) above the red line. Can take profit at the suggested Target Price.
Entry Price: $132.62
Target Price: $130.46
Stop Loss: $136.22
SJMIt looks like a cup with a handle. Whether there was a "handle" or there will still be a subjective question, but if the current week holds the level / the next Monday will be green, we can generally expect growth.
In general, the height can be the height of the cup (should be). But the size of the handle is not bad either


LONG JM SMUCkERA; local favorite around here .. the JM SMUCKER company is paying a nice 3.0% yield on their div and has also formed a cup and handle pattern on the daily and looks like it's about to take off to break ATHs soon It had trouble breaking $135 last week, but it didn't crash like the rest of the market After reporting earnings on the 23rd and beating expectations in by 18%; they were able to open at $131.26 after closing the previous day at $126.44 Even with all the FUD in the market they closed at $130.95 Once they break $135, the last major resistance sitting between them and the previous all-time high of $157.31i is $139.77
I'm gonna buy asap to lock in my div yield and enjoy the (hopefully) ride up.

The J.M. Smucker Co. Declares Dividend and Authorizes AdditionalSJM: The J. M. Smucker Company
2021-10-22 16:30:00
The J.M. Smucker Co. Declares Dividend and Authorizes Additional Shares for Future Repurchase


SJM about to break outSJM is predictably about to begin an assent towards an ATH. You can see for yourself. Also, SJM beat analyst forecasts, so they will be making adjustments in rapid succession. I would venture to say, we are at a low right now, the likes of which we probably won't see again for quite a time to come. It's value. Bullish.

Traditional|SJM|Long and shortLong SJM
Activation of the transaction only when the blue zone is fixed/broken.
The idea is to working out the support and resistance levels of the consolidation triangle.
*Possible closing of a trade before reaching the take/stop zone.
The "forecast" tool is used for more noticeable display of % (for the place of the usual % scale) of the price change, I do not put the date and time of the transaction, only %.
Blue zones - activation zones.
Green zones - take zones.
The red zone - the stop zone.
Working out the stop when the price returns to the level after activation + fixing in the red zone, breaking the red zone as the support level of the triangle and the channel.
Orange arrow - the direction of take.
Blue arrow - neutral scenario without activating the trade.
The red arrow - the direction of the stop.


What is the best target entry for $SJM?I am very bullish $SJM. However, (mid day as of today), it's pretty weak price action. I'd like to test the best entries depending on varying systems. What is $SJM's personality?
Long term my target is still 138 by February 2021. We'll see.
Here's my original analysis.

SJMAccording to the Elliott Wave theory
SJM is already made A-B-C-D-E waves inside symmetrical triangle
Keep follow the chart and enter on the breakout

Smuckers is my JAM!Just look at this chart!
If you wanted to get an absolute filthy fill, you'd wait for that touch or break (wave E) to just below 112 then LOAD THE BOAT with Apr 130 calls (currently at $2.60, but you can get them for cheaper)
I see some volume on the 110 12/18 Puts that were bought earlier this month (when price was 117). I def think we're heading down then heading right back up!
HOW TO TRADE:
The general rule is that triangles take 1/3 of time to hit their target as the duration of their coil. That puts this at around 70 days, or just over two months to hit 140. (Valentines day). If you don't get the fill on 112, play the breakout (and even the retest of the breakout, if you're reading this late after they put out some BS PR about how JAM IS THE COVID FUTURE or some garbage JAM + PEANUTBUTTER partnership.
Stoploss is 107.
This is a great play (albeit a slow mover).


BUY to SMUCKER(J.M)CO Hey my friends, SMUCKER(J.M)CO is in a fake bearish push we observe strong sales volume especially at the end of the session with attempts by aborted buyers. SMUCKER (J.M) CO has gone out of his zone of equilibrium but it seems to make a reversal to the level of last previous low point.
In this situation we can go to the top of the zone for the breakout and look for the next high point which corresponds to the daily at the same time breaking the second equilibrium zone.
Please LIKE & FOLLOW, thank you!

How to make $1,000,000 next month! JK.. Let's talk about snacksI've been a very big fan of companies that own packaged food brands (snacks) the American people love. Especially brands that are being stocked in large quantities in times of distress, like a pandemic. Not only is playing good defense very attractive right now from a technical standpoint, it also makes a lot of sense logically when you think about risk. There is a flight to quality happening in the institutional world. Capital has to flow somewhere. Funds cannot just sit in cash, nor could they go all in on bonds, gold or tech stocks (which happen to be the safe haven at the moment). They need something (a company) that could reliably forecast its earnings power in the next x months or years. Companies that will continue ringing the register with no surprises, minimal uncertainty, no matter how bad a viral pandemic could get.
Now here is where things get interesting. Times of crisis *usually* represent bottoms in markets. Are we at that point in history now? I think we are, at least in time - maybe 2020, maybe 2021. 10 or 20 years from now you won't know the difference. So we could use the analysis above as an indicator for the broader economy, or let your capital flow into defensive stocks and sleep well at night. A combination of both works too.
Now I think the S&P is at a level where it's about to roll over (currently at 2950, I think we're about 80 points max from an intermediate top - see my April 24th publication on the S&P 500). So Smucker's could see some downside before breaking out. The range of interest is between 101 - 116. It's a buy anywhere inside of there. I know everyone on TradingView is a day trader and wants to make millions overnight. So I'm sorry that this is a 5-10 year horizon trade. Call options are another way to make a big return on Smucker's.. ;). Just throwing ideas.
Thanks for reading. Adios

Buy THE J.M SMUCKER COMPANY [NYSE: $SJM] | 5.12.2020 | Eric ChoeMy name is Eric Choe.
I am a professional trader with over 7 years of equities and cryptocurrency experience.
I've worked at an energy trading company, a Fortune 500 company, and one of the top management consulting firms in the world.
I left my high-paying salary as a management consultant in early 2018 for a career in investing and trading.
I've been a full-time equities trader ever since.
I give detailed analysis on TradingView.
Over the past 7 years, I've dedicated my time and effort to helping others learn about the financial markets.
All my ideas are for education purposes. There is a high-degree of risks involving leverage trading. Trade at your own risk. This is not financial advice
