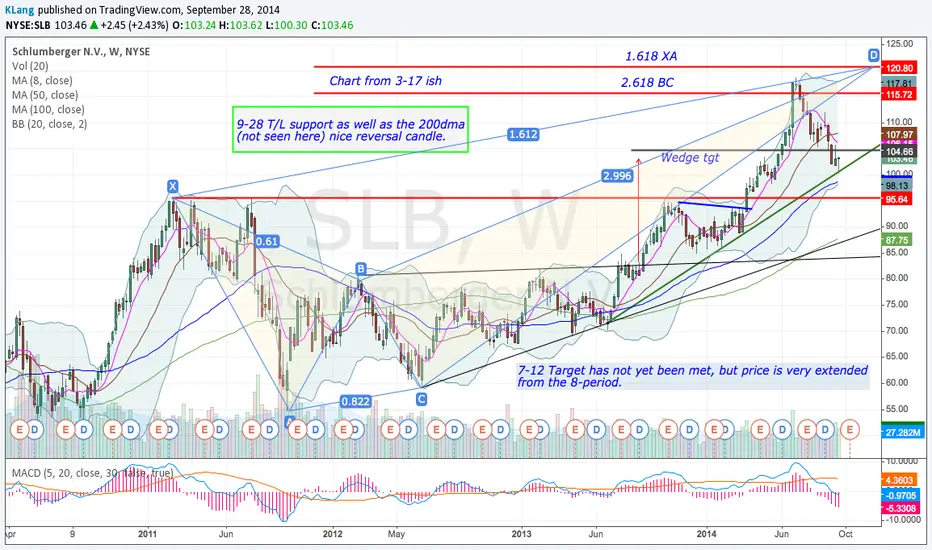
Schlumberger doesn't slump?Moving averages was left out to avoid complication of analysis.
Schlumberger is in a decade-term uptrend channel since 1988. Ever since the top at 110 in July 2008, the price has been in consolidation triangle form until Sept 2013 when price broke out convincingly.
However, the historical price of 110 was too much of a resistance, after a false broke up, June-July 2014 gave a dark cloud which resulted in 3 consecutive selling month.
It remains to be seen whether when Oct is completed, RSI uptrend line would be able to provide the support (Blue region), in case support is strong and uptrend continues, major upside resistance is still between 110-116
If support isn't strong, and price closed below the trend line, then ultimately the price might drop to 74, which i will have to use daily to assess the congruency with separate post.
SLB trade ideas

SLB sentiment changing to bearishDuring this recent move up in S&P (100 handles from the last bottom) Oil&Gas ($XOP) stayed one of the weakest sectors and specifically shares of Slumberger.
After exhausted move up on the end of June, it entered into correction and broke down its 50 EMA that was in control since the beginning of 2014.
Now, sellers keep preassure and hold resistance at $110 which could be stop line for short position.
My approach is active trade management. Initiate tier 1 now, then add on break down of $107.50 gap point, then add if it will close and hold below $105.39 with target at $102 - reasonable level, earlier it acted like resistance and now should act like support.

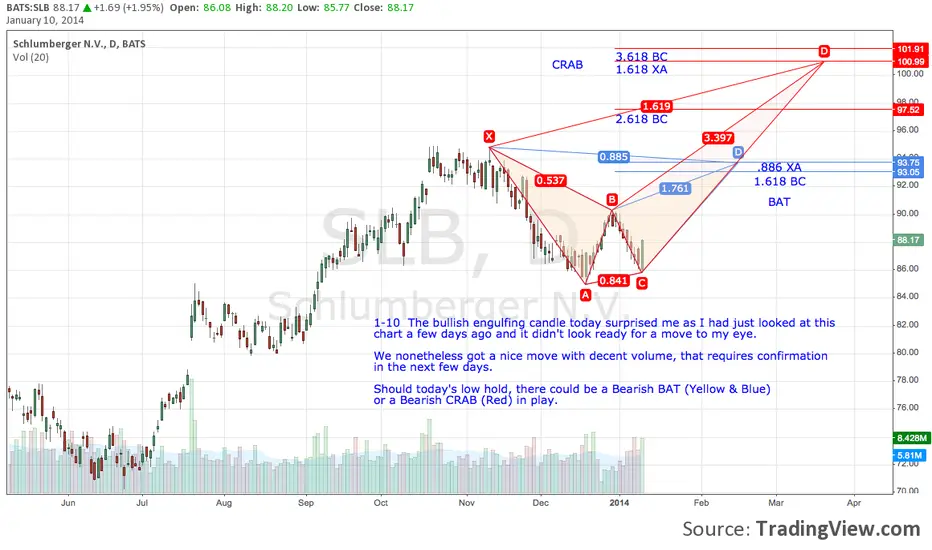
SLB - Pullback on Daily, Double Bottom 60minTradingview is not allowing me to write in all my comments. . .
Pullback
Status: Watching 60min
Point system: 1 = meets criteria, 0 = fails or not applicable
Total points: 9 / 12
Cost basis:
Stop:
First price target:
Technicals:
Horizontal S&R: 0
Channel S&R: 1
MA S&R: 0
Pearson's R >= 85: 1
Price within Fib Ret..62: 1
Stochastic turn/crossover above 80%: 1 (and w/ divergence)
AO pullback >01.6: 4.5, 1

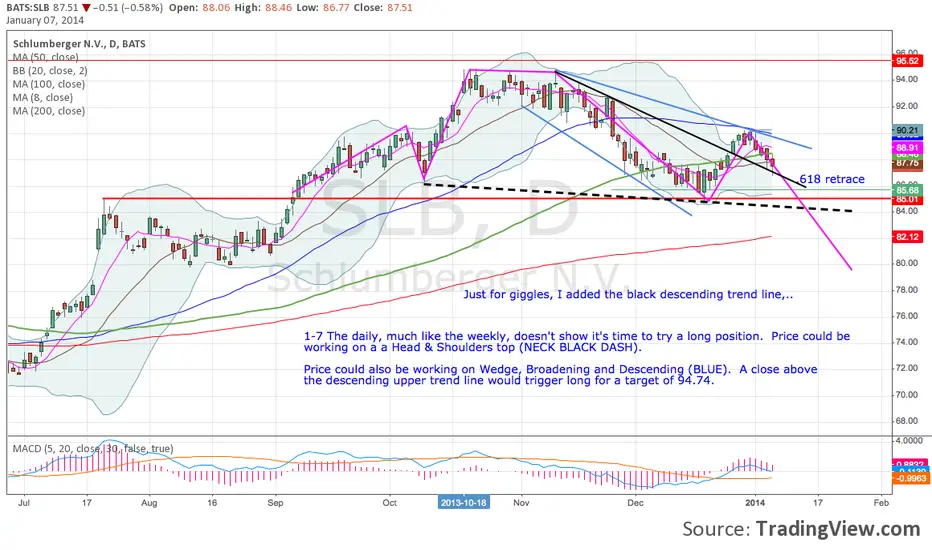
SLB - flagHorizontal S&R: no
Channel S&R: yes
MA S&R: no
Stochastic turn/crossover above 80%: no
AO pullback >0= 85: yes
Price Pullback Fib >0.382: yes
Increasing EPS: yes
Increasing Rev: yes
*stop 1 atr below swing low.
** first price target is 50% the move from entry price to previous high.
***No Biotech

REPUBLISHING SCHLUMBERGER SLB FORECAST FROM JULY 2013 REPOSTING:
"Massive 5-year triangle in SLB shares has come to a conclusion because the trendline connecting the "highest lows" across the previous rally highs has been surpassed, suggesting that the selling pressure is off of the stock.
I noted four other previous rally's in SLB pasted onto the most recent low for reference. I simply thought it was interesting to see how fast it has rallied at times in the past. This stock gets into momentum stages very quickly.
The recent breakout occurred from a multi-month sideways "box" or accumulation zone labeled in green. Old resistance levels existed that SLB had to get through, but now that both resistance levels have been crossed, it appears that SLB is set to grind out a rally to higher levels near 90, then 100.
I believe SLB will outperform the market also, so if you plot this stock against the SP500 using SPY, it may be important to keep an eye on SLB/SPY to make sure that ratio is plotting along too during the course of this rally.
Cheers.
Tim 3:29PM EST, Wednesday, Aug 28, 2013 "

Target achieved. I think now is a move in the opposite directionTarget achieved. I think now is a move in the opposite direction.

SLB - Weekly and daily are in lineWeekly chart here
The daily chart is offering a very good risk/reward setup. At the moment price is closing the overnight gap down, and probably it will continue up a few cents.
Bearish divergences on the MACD histogram and FI point to a correction. First target is at 95, second at 90.


Watch This Intra-day Level On SLB $SLB has chart support around the $89.00 level. That level was a previous breakout point on the 60 minute chart, which will now be chart support. There is also a rising 200-period moving average (SMA) just below that level. The $89.00 area is a likely intra-day bounce level - for a day trade.

