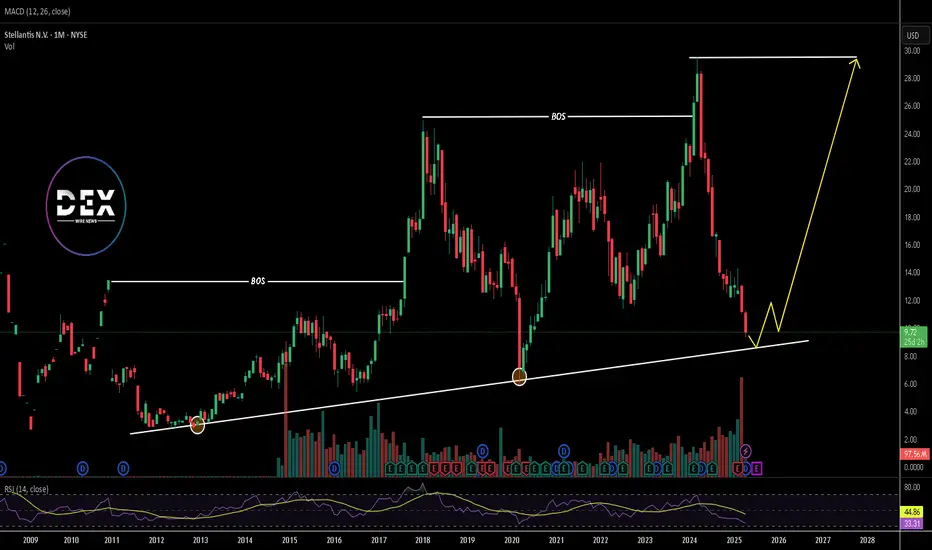
Stellantis | STLA | Long at $9.59Stellantis NYSE:STLA is the maker of the auto brands Fiat, Peugeot, Jeep, Citroën, Opel/Vauxhall, Ram Trucks, Dodge, Chrysler, Alfa Romeo, Maserati, DS Automobiles, Lancia, Abarth, and Vauxhall. The stock has fallen sharply due to a 70% profit drop in 2024, weak U.S. sales, high inventory, and tar
Next report date
—
Report period
—
EPS estimate
—
Revenue estimate
—
1.88 USD
5.67 B USD
162.40 B USD
1.92 B
About STELLANTIS
Sector
Industry
CEO
Antonio Filosa
Website
Headquarters
Hoofddorp
Founded
2014
ISIN
NL00150001Q9
FIGI
BBG0078ZLDG9
Stellantis NV engages in the design, manufacture, distribution, and sale of vehicles. It offers its products under the Abarth, Alfa Romeo, Chrysler, Citroën, Dodge, DS, Fiat, Fiat Professional, Jeep, Lancia, Opel, Peugeot, Ram, and Vauxhall brands. The company was founded on April 01, 2014 and is headquartered in Hoofddorp, the Netherlands.
Related stocks

Stellantis a buy idea - May 2025 - 8.757Its still one of the dominant player in EU region and technically now falling into buy zone marking a least of 40% profit from current levels.
Its taking support on monthly Fibonacci levels and harmonic levels.
PS: Please do consider your risk appetite before considering it.

Stellantis N.V.Key arguments in support of the idea
The company's shipments are projected to recover in the latter half of the year.
STLA's valuation appears significantly lower compared to its industry peers
Investment Thesis
Stellantis N.V. Stellantis N.V. (STLA), a leading global automotive manufactur

Stellantis N.V. Halts Windsor Production Amid U.S. Auto TarriffsStellantis N.V. (NYSE: NYSE:STLA ) has announced temporary shutdowns at its Canada and Mexico plants in response to new U.S auto tariffs. These actions come shortly after the U.S. government imposed a 25% tariff on imported vehicles.
The automaker will pause operations at its Windsor Assembly Pl
STLA | Long | Strong Support Zone | (April 2025)STLA | Long | Strong Support & Technical Support Zone | (April 2025)
1️⃣ Insight Summary:
Stellantis (STLA) is trading at an attractive level, both technically and fundamentally. With solid cash flow, low valuation, and upcoming earnings in focus, this could be a key area for potential rotation — e

STELLANTIS (STLAM): Opportunity or crisis? Stellantis CEO Carlos Tavares submitted his resignation to the board of directors chaired by John Elkann, which accepted it. The announcement had come last October that Tavares would lead the carmaker until 2026, helping the company in its search for a new CEO. However, falling profits and the comp

"STLA" (Stellantis) Buy Opportunity at Strong SupportTicker: NYSE:STLA (Stellantis)
Long Entry: Near current support level
Target: All-Time High (ATH) , could be splitted
Stop-Loss: Just below current LOW
Risk-Reward Ratio: ~1:24
Analysis:
Stellantis (STLA) has pulled back to a strong historical support level, aligning with an old bull

Stellantis (STLA) Plunges Amid Profit Warning and Market TurmoilStellantis (NYSE: NYSE:STLA ), the parent company of iconic brands such as Chrysler and Jeep, is facing a stormy outlook as the global automotive market is hammered by competition and declining industry dynamics. On Monday, the company shocked the market by issuing a profit warning and slashing its

STELLANTISCorrection incomming
Hope to see a perfect H&S. So first a strong buy to the upside and then 5 waves down to the 4.58 area. Lets see what will happen.

$STLA waiting to buyStelantis is dropping like a rock, but I will be buying the break of the red downtrend line and adding at the break of the channel.

See all ideas
Summarizing what the indicators are suggesting.
Neutral
SellBuy
Strong sellStrong buy
Strong sellSellNeutralBuyStrong buy
Neutral
SellBuy
Strong sellStrong buy
Strong sellSellNeutralBuyStrong buy
Neutral
SellBuy
Strong sellStrong buy
Strong sellSellNeutralBuyStrong buy
An aggregate view of professional's ratings.
Neutral
SellBuy
Strong sellStrong buy
Strong sellSellNeutralBuyStrong buy
Neutral
SellBuy
Strong sellStrong buy
Strong sellSellNeutralBuyStrong buy
Neutral
SellBuy
Strong sellStrong buy
Strong sellSellNeutralBuyStrong buy
Displays a symbol's price movements over previous years to identify recurring trends.
Curated watchlists where STLA is featured.

Frequently Asked Questions
The current price of STLA is 9.70 USD — it has increased by 5.74% in the past 24 hours. Watch Stellantis N.V. stock price performance more closely on the chart.
Depending on the exchange, the stock ticker may vary. For instance, on NYSE exchange Stellantis N.V. stocks are traded under the ticker STLA.
STLA stock has risen by 8.57% compared to the previous week, the month change is a 0.90% rise, over the last year Stellantis N.V. has showed a −44.98% decrease.
We've gathered analysts' opinions on Stellantis N.V. future price: according to them, STLA price has a max estimate of 15.30 USD and a min estimate of 7.06 USD. Watch STLA chart and read a more detailed Stellantis N.V. stock forecast: see what analysts think of Stellantis N.V. and suggest that you do with its stocks.
STLA reached its all-time high on Mar 25, 2024 with the price of 29.51 USD, and its all-time low was 2.76 USD and was reached on Feb 23, 2009. View more price dynamics on STLA chart.
See other stocks reaching their highest and lowest prices.
See other stocks reaching their highest and lowest prices.
STLA stock is 6.07% volatile and has beta coefficient of 1.63. Track Stellantis N.V. stock price on the chart and check out the list of the most volatile stocks — is Stellantis N.V. there?
Today Stellantis N.V. has the market capitalization of 28.60 B, it has decreased by −5.55% over the last week.
Yes, you can track Stellantis N.V. financials in yearly and quarterly reports right on TradingView.
Stellantis N.V. is going to release the next earnings report on Jul 29, 2025. Keep track of upcoming events with our Earnings Calendar.
STLA earnings for the last half-year are 0.08 USD per share, whereas the estimation was 0.25 USD, resulting in a −66.27% surprise. The estimated earnings for the next half-year are 0.56 USD per share. See more details about Stellantis N.V. earnings.
Stellantis N.V. revenue for the last half-year amounts to 74.39 B USD, despite the estimated figure of 73.53 B USD. In the next half-year revenue is expected to reach 87.94 B USD.
STLA net income for the last half-year is −156.32 M USD, while the previous report showed 6.02 B USD of net income which accounts for −102.59% change. Track more Stellantis N.V. financial stats to get the full picture.
Yes, STLA dividends are paid annually. The last dividend per share was 0.77 USD. As of today, Dividend Yield (TTM)% is 8.00%. Tracking Stellantis N.V. dividends might help you take more informed decisions.
Stellantis N.V. dividend yield was 5.40% in 2024, and payout ratio reached 36.65%. The year before the numbers were 7.33% and 25.90% correspondingly. See high-dividend stocks and find more opportunities for your portfolio.
As of Jul 29, 2025, the company has 248.24 K employees. See our rating of the largest employees — is Stellantis N.V. on this list?
EBITDA measures a company's operating performance, its growth signifies an improvement in the efficiency of a company. Stellantis N.V. EBITDA is 13.11 B USD, and current EBITDA margin is 8.07%. See more stats in Stellantis N.V. financial statements.
Like other stocks, STLA shares are traded on stock exchanges, e.g. Nasdaq, Nyse, Euronext, and the easiest way to buy them is through an online stock broker. To do this, you need to open an account and follow a broker's procedures, then start trading. You can trade Stellantis N.V. stock right from TradingView charts — choose your broker and connect to your account.
Investing in stocks requires a comprehensive research: you should carefully study all the available data, e.g. company's financials, related news, and its technical analysis. So Stellantis N.V. technincal analysis shows the sell today, and its 1 week rating is sell. Since market conditions are prone to changes, it's worth looking a bit further into the future — according to the 1 month rating Stellantis N.V. stock shows the sell signal. See more of Stellantis N.V. technicals for a more comprehensive analysis.
If you're still not sure, try looking for inspiration in our curated watchlists.
If you're still not sure, try looking for inspiration in our curated watchlists.