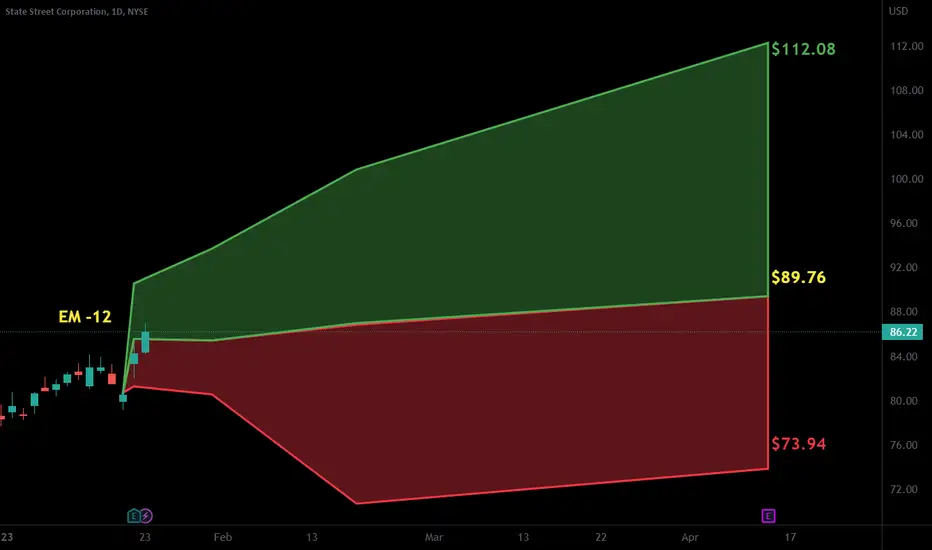
STT - sideway near 6 monthsSTT sideway long time then up.
Historically, after the MA50 crosses the MA200, the price will move sideways in a band below the MA200 for at least 120 trading days. With chart frame Day.
The price now: $81.22 (04.17.2022).
Price band: $84.24 - $75.50.
If breakout Up, price target: $90.18.
If the p
Next report date
—
Report period
—
EPS estimate
—
Revenue estimate
—
9.06 USD
2.69 B USD
21.19 B USD
283.56 M
About State Street Corporation
Sector
Industry
CEO
Ronald Philip O'Hanley
Website
Headquarters
Boston
Founded
1792
FIGI
BBG000BKFBD7
State Street Corp. engages in the provision of financial services to institutional investors. It operates through the Commercial and Financial Loans, and Commercial Real Estate Loans segments. The company was founded in 1792 and is headquartered in Boston, MA.
Related stocks

$STT with a bullish outlook following its earnings #StocksThe PEAD projected a bullish outlook for NYSE:STT after a negative over reaction following its earnings release placing the stock in drift C with an expected accuracy of 75%.

STT State Street Corporation Options Ahead of EarningsIf you haven`t sold STT before the previous earnings:
Then analyzing the options chain and the chart patterns of STT State Street Corporation prior to the earnings report this week,
I would consider purchasing the 72.50usd strike price Puts with
an expiration date of 2024-4-19,
for a premium of ap

STT State Street Corporation Options Ahead of EarningsAnalyzing the options chain of STT State Street Corporation prior to the earnings report this week,
I would consider purchasing the 75usd strike price Puts with
an expiration date of 7/21/2023,
for a premium of approximately $1.75.
If these options prove to be profitable prior to the earnings releas

April Gainers (STT, account up 0.5%)8th trade in April is NYSE:STT .
Holding period is 31 days (3/14/23-4/14/23).
Account is up 0.5%.
Total return in April is 1.65%

Bullish Breakout Potential: $STT Approaches $100 ResistanceThe trend for $STT stock appears bullish as it approaches the resistance level of $100. The stock has been consistently trading above the support level of $88, providing further confidence in the bullish trend. It's important to monitor the stock's performance at the $100 resistance level and evalua

$STT with a Bullish outlook following its earnings #Stocks The PEAD projected a Bullish outlook for $STT after a Positive Under reaction following its earnings release placing the stock in drift A with an expected accuracy of 77.78%.
STTlooks like a bullish pennant to me, gotta see how it plays out over coming days / weeks
in next few days its either going to bounce off upper bollinger band and come down to the MA's, or break through it and continue the uptrend after the consolidation period its currently in.
either way keeping a c

$STT Swing Trading Pullback or ReversalNYSE:STT
It seems it has good direction to the upside, the lower lows might indicate this is a "falling knife" type of situation. Yet, there is a strong support line at Fibo and at 77.07.

$STT with a Bearish outlook following its earnings #Stocks The PEAD projected a Bearish outlook for $STT after a Positive over reaction following its earnings release placing the stock in drift B with an expected accuracy of 71.43%.

See all ideas
Summarizing what the indicators are suggesting.
Neutral
SellBuy
Strong sellStrong buy
Strong sellSellNeutralBuyStrong buy
Neutral
SellBuy
Strong sellStrong buy
Strong sellSellNeutralBuyStrong buy
Neutral
SellBuy
Strong sellStrong buy
Strong sellSellNeutralBuyStrong buy
An aggregate view of professional's ratings.
Neutral
SellBuy
Strong sellStrong buy
Strong sellSellNeutralBuyStrong buy
Neutral
SellBuy
Strong sellStrong buy
Strong sellSellNeutralBuyStrong buy
Neutral
SellBuy
Strong sellStrong buy
Strong sellSellNeutralBuyStrong buy
Displays a symbol's price movements over previous years to identify recurring trends.
STT5705283
State Street Corporation 6.123% 21-NOV-2034Yield to maturity
5.15%
Maturity date
Nov 21, 2034
STT6016611
State Street Corporation 5.146% 28-FEB-2036Yield to maturity
5.08%
Maturity date
Feb 28, 2036
STT5530633
State Street Corporation 4.821% 26-JAN-2034Yield to maturity
4.94%
Maturity date
Jan 26, 2034
STT5588085
State Street Corporation 5.159% 18-MAY-2034Yield to maturity
4.85%
Maturity date
May 18, 2034
STT5412925
State Street Corporation 4.421% 13-MAY-2033Yield to maturity
4.81%
Maturity date
May 13, 2033
S
STT5945592
State Street Bank and Trust Company FRN 25-NOV-2026Yield to maturity
4.74%
Maturity date
Nov 25, 2026
See all STT bonds
Curated watchlists where STT is featured.


Frequently Asked Questions
The current price of STT is 112.93 USD — it has increased by 1.76% in the past 24 hours. Watch State Street Corporation stock price performance more closely on the chart.
Depending on the exchange, the stock ticker may vary. For instance, on NYSE exchange State Street Corporation stocks are traded under the ticker STT.
STT stock has risen by 4.90% compared to the previous week, the month change is a 9.70% rise, over the last year State Street Corporation has showed a 35.91% increase.
We've gathered analysts' opinions on State Street Corporation future price: according to them, STT price has a max estimate of 131.00 USD and a min estimate of 105.00 USD. Watch STT chart and read a more detailed State Street Corporation stock forecast: see what analysts think of State Street Corporation and suggest that you do with its stocks.
STT stock is 3.24% volatile and has beta coefficient of 1.15. Track State Street Corporation stock price on the chart and check out the list of the most volatile stocks — is State Street Corporation there?
Today State Street Corporation has the market capitalization of 32.21 B, it has decreased by −4.70% over the last week.
Yes, you can track State Street Corporation financials in yearly and quarterly reports right on TradingView.
State Street Corporation is going to release the next earnings report on Oct 21, 2025. Keep track of upcoming events with our Earnings Calendar.
STT earnings for the last quarter are 2.53 USD per share, whereas the estimation was 2.35 USD resulting in a 7.64% surprise. The estimated earnings for the next quarter are 2.54 USD per share. See more details about State Street Corporation earnings.
State Street Corporation revenue for the last quarter amounts to 3.47 B USD, despite the estimated figure of 3.35 B USD. In the next quarter, revenue is expected to reach 3.41 B USD.
STT net income for the last quarter is 693.00 M USD, while the quarter before that showed 643.00 M USD of net income which accounts for 7.78% change. Track more State Street Corporation financial stats to get the full picture.
Yes, STT dividends are paid quarterly. The last dividend per share was 0.76 USD. As of today, Dividend Yield (TTM)% is 2.63%. Tracking State Street Corporation dividends might help you take more informed decisions.
State Street Corporation dividend yield was 2.95% in 2024, and payout ratio reached 35.30%. The year before the numbers were 3.41% and 47.34% correspondingly. See high-dividend stocks and find more opportunities for your portfolio.
As of Jul 27, 2025, the company has 52.63 K employees. See our rating of the largest employees — is State Street Corporation on this list?
Like other stocks, STT shares are traded on stock exchanges, e.g. Nasdaq, Nyse, Euronext, and the easiest way to buy them is through an online stock broker. To do this, you need to open an account and follow a broker's procedures, then start trading. You can trade State Street Corporation stock right from TradingView charts — choose your broker and connect to your account.
Investing in stocks requires a comprehensive research: you should carefully study all the available data, e.g. company's financials, related news, and its technical analysis. So State Street Corporation technincal analysis shows the strong buy rating today, and its 1 week rating is buy. Since market conditions are prone to changes, it's worth looking a bit further into the future — according to the 1 month rating State Street Corporation stock shows the strong buy signal. See more of State Street Corporation technicals for a more comprehensive analysis.
If you're still not sure, try looking for inspiration in our curated watchlists.
If you're still not sure, try looking for inspiration in our curated watchlists.