TTI – 30-Min Long Trade Setup!📌
🔹 Asset: Tetra Technologies, Inc. (TTI)
🔹 Timeframe: 30-Min Chart
🔹 Setup Type: Descending Wedge Breakout Long Trade
📌 Trade Plan (Long Position)
✅ Entry Zone: Above $4.26 (Breakout Confirmation)
✅ Stop-Loss (SL): Below $4.06 (Break of Support & Trendline)
🎯 Take Profit Targets
📌 TP1: $4.54 (First Resistance Level)
📌 TP2: $4.80 (Final Target – Extended Bullish Move)
📊 Risk-Reward Ratio Calculation
📈 Risk (SL Distance): $4.26 - $4.06 = $0.20 risk per share
📈 Reward to TP1: $4.54 - $4.26 = $0.28 (1.4 R/R)
📈 Reward to TP2: $4.80 - $4.26 = $0.54 (2.7 R/R)
🔍 Technical Analysis & Strategy
📌 Descending Wedge Breakout Setup: TTI has been consolidating in a downward-sloping wedge, with a breakout expected at $4.26.
📌 Trendline & Support Bounce: The price is attempting to break out of the wedge, indicating buyer accumulation.
📌 Breakout Confirmation: A strong bullish candle above $4.26 with increasing volume would confirm momentum.
📌 Momentum Shift Expected: If price holds above $4.26, a rally toward $4.54 (TP1) and $4.80 (TP2) is likely.
📊 Key Support & Resistance Levels
🟢 $4.06 – Strong Support / Stop-Loss Level
🟡 $4.26 – Entry / Breakout Level
🔴 $4.54 – First Resistance / TP1
🟢 $4.80 – Final Target / TP2
🚀 Trade Execution & Risk Management
📊 Volume Confirmation: Ensure strong buying volume above $4.26 before entering.
📈 Trailing Stop Strategy: Move SL to entry ($4.26) after TP1 ($4.54) is hit.
💰 Partial Profit Booking Strategy:
✔ Take 50% profits at $4.54, let the rest run to $4.80.
✔ Adjust Stop-Loss to Break-even ($4.26) after TP1 is reached.
⚠️ Fake Breakout Risk
❌ If price fails to hold above $4.26 and breaks back down, it could indicate a false breakout—exit early.
❌ Wait for a strong candle close above $4.26 for confirmation before entering aggressively.
🚀 Final Thoughts
✔ Bullish Setup – Holding above $4.26 could lead to higher targets.
✔ Momentum Shift Possible – Watch for volume confirmation.
✔ Favorable Risk-Reward Ratio – 1:1.4 to TP1, 1:2.7 to TP2.
💡 Stick to the plan, manage risk, and trade smart! 🚀🏆
🔗 #StockTrading #TTI #TetraTechnologies #BreakoutTrade #TechnicalAnalysis #MarketTrends #ProfittoPath #DayTrading #MomentumStocks #SwingTrading #TradingView #LongTrade #TradeSmart #RiskManagement #StockBreakout #Investing #StockAlerts #ChartAnalysis 🚀📈
TTI trade ideas
Prepare to follow price within Range upwardsWIth a support of 4usd being maintained and previously broken quite easily in DEC 2024 shortly after being rejected above 5USD the potential for this ticker TTI has much more room for growth on a longer term aspect. Price continues to maintain its upwards tragectory, Fundamentally this stock is undervalued, the service they provide and the price is an understatement of their service.
On A technical aspect price remaining above 4-4.20usd has been met with signifcant buying of the dips in price, continue to monitor this on a longer time perspective as this may prove beneficial for those who hold this undervalued company. The board of directors in this company are to be held in high regard, many of the growth potentials are there and I believe they will provide a significant return on investment in the future ahead.

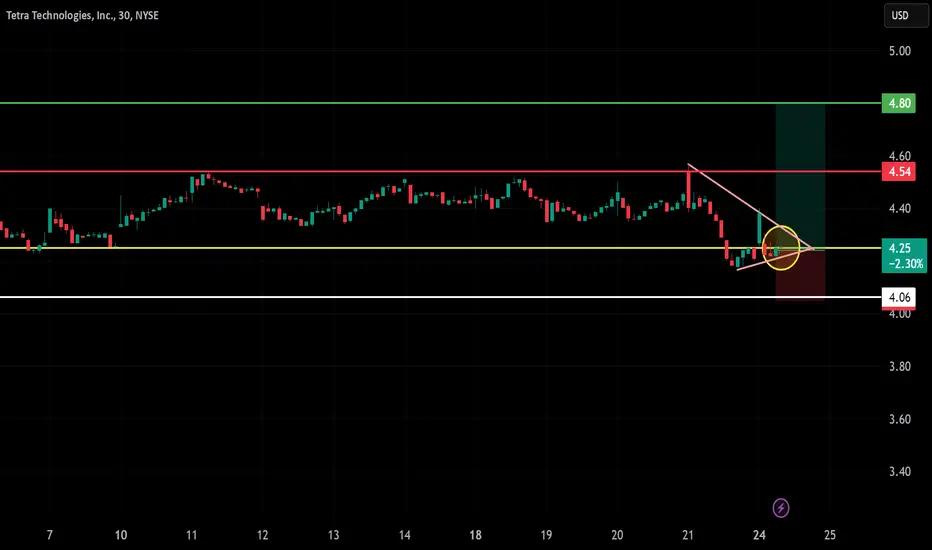
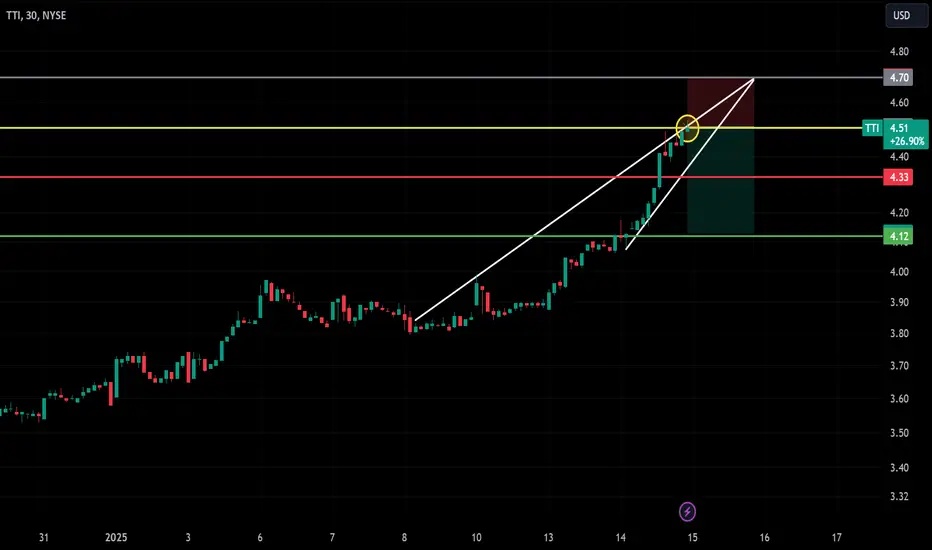
TTI Short Trade Setup | Entry, SL, T1, T2 !Type: Short Trade 📉
Entry Point: $4.50 (or your precise entry from the chart)
Stop Loss (SL): $4.70 (marked in red) 🚫
Target 1 (T1): $4.33 (marked in yellow) 🟡
Target 2 (T2): $4.12 (marked in green) ✅
Reason for Short: Rising wedge pattern breakdown with a potential rejection near resistance at $4.70.
Confirmation: Breakdown of trendline with volume increasing on the downside.
Timeframe: 30-minute chart.
TTI - LONGNeuberger Berman Group LLC recently acquired Tetra Technologies Inc., showing their belief in the company’s potential for growth, especially in the energy sector. Hedge fund interest in Tetra is stable, with 22 holders still invested, reflecting ongoing confidence in its performance. The company is also experiencing a breakout from a wedge pattern, with price targets of $5.35 for Target 1 and $7.38 for Target 2, making it an appealing investment option.

TTI: Bullish Pennant, confirmed (56,08%)(23/1000)(23/1000)
Bullish Pennant pattern for TTI. Confirmed
56,08% possible gains.
Pros:
1- PPS above 50MA and 200MA
2- RS above 0 and climbing
3- R/R ratio above 5
4- 250RSI above 50 and climbing
5- 50MA above 200MA
6- Both 50MA and 200MA ascending
7- Golden cross circled in blue
8- Descending volume during pennant forming
9- Volume during post forming
10- Volume at break out
Cons:
1- ATR flat, less volatile
2- Gap was formed during post. At risk of a gap fill.
Target price is 8,29$
Stay humble, have fun, make money!
MAAX

TTITechnical only :
Adding to my watch list in order to get a direction from the market.
There is a positive and a negative scenario.
Positive scenario - W pattern - Our first entry will be above 4.20 and our second entry will be above 4.50 with potential target of 5.75$.
The negative scenario - Below 3.76$ we will jump in to short position and even increase my holding if we will break the important 3.55$ level.
Our potential target will be 2.7 and than 2.35.
DYOR 🙊🍒
Manage your own risks

$TTI ~ Correction in progress...As shown, majority of energy stocks are starting to correct. Looking into the future, we believe these companies will provide amazing opportunities. We expect barrels of oil to reach $300-400 a barrel by the end of the decade. Recommend tracking this sector very closely for amazing opportunities.

Tetra Technologies (TTI) RECALL ALERT!Hello everyone,
It is with the utmost conviction that I must return to a trade posted on June 7th, 2022, and admit, I was WRONG. I have to own it... the breakout has failed; I have stopped out of this trade.

Tetra Technologies (TTI) Breaking outI have bought TTI and I am looking for $15ish, where I will plan to reduce 50% and hold until it reaches the all time high near $30.


TTI BullishI like the 9 ema crossing the 20 ema and also the 50 MA. I also like the recent MACD cross and the the price taking out multiple fibonacci levels in the last 4 trading days. Will look for a long swing at $2.91+ or $2.79 if it retraces.

$TTI - bull pennantwatching to break up here
Entered commons yesterday
Testing a new tool and plan to hold no longer than 5-10 days
Target 10-20% gains


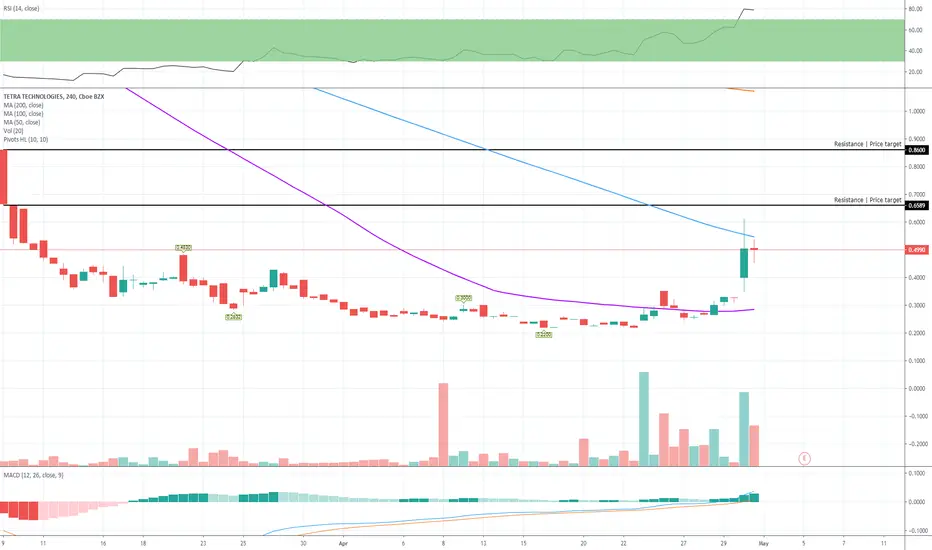
TTI: microcap to consider: LONGI gave the long term for chart those who like to count ( EWT ). If you don't ignore the numbers and focus on the 2 hour chart. Also it shows the danger of a inverted cup.
This looks like a good time for the most current down trend line to be broken. If it is I personally will consider it a buy with a close below the most recent low (.4798) as a stop. My target box is shown.
All microcaps are risky. AS Always process your own way.
For a good looks at what this company is about see:
seekingalpha.com

Tetra Technologies TTI ready for big bullish moveTTI making nice bullish moves created a Three Rising Valleys formation. On Friday we tried to break out but couldn't close above the break out level of .7775. I would keep a close eye on this asset as its looking very bullish. Valley 3 created the abandoned baby candlesticks. Also on the 4hr chart we can see that the last candle went to find support and bounced back looking for a take off Monday hopefully on this one. Also the 50 and 200 EMA just had a bullish crossover on the 4 hr.


$TTI moving pre Market 40% upside Potential Quarterly Results
Earnings per share increased 150.00% over the past year to $0.02, which beat the estimate of ($0.08).
Revenue of $222,942,000 less by 8.53% from the same period last year, which beat the estimate of $221,650,000.
Guidance
Tetra Technologies hasn't issued any earnings guidance for the time being.
Tetra Technologies hasn't issued any revenue guidance for the time being.

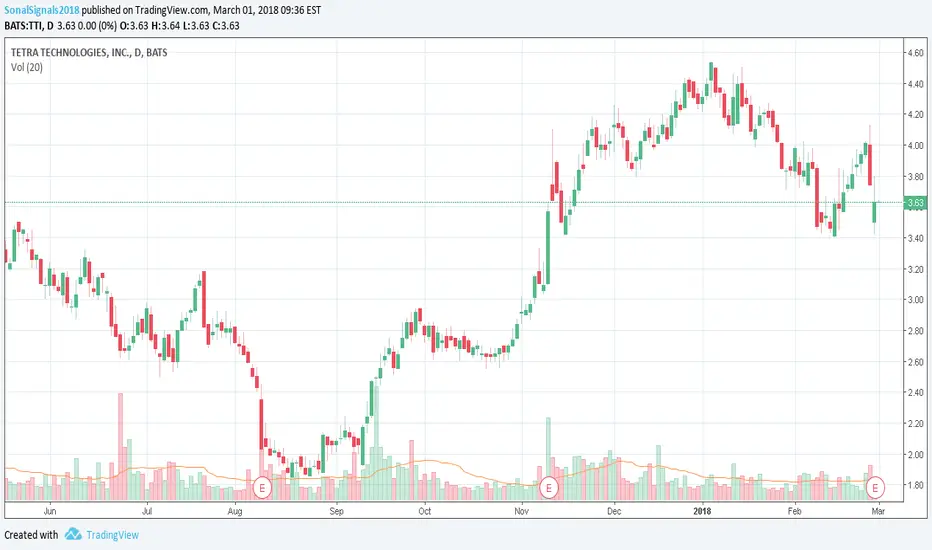
TETRA Technologies, Inc, looking for continuation TETRA Technologies, Inc. is a geographically diversified oil and gas services company. It engages in the completion of fluids and associated products and services. It operates through the following segments: Completion Fluids and Products; Compression; and Water and Flowback Services. The Completion Fluids and Products division manufactures and markets clear brine fluids, additives, and associated products and services to the oil and gas industry. The Compression division offers compression services and equipment for natural gas and oil production, gathering, transportation, processing, and storage. The Water and Flowback Services division provides onshore oil and gas operators with comprehensive water management services. The company was founded in 1981 and is headquartered in The Woodlands, TX.

TTI: Long opportunityAn intraday high potential, Back Tested Long Analysis.
We ll try to find an entry price within the expected pull back zone 3.36 - 3.43 as previously being back tested.
CCI diverges the price crossing up the zero level as well as shown in the chart.
DETAILS ON THE CHART
NOTE: Entry range area above the entry point, is calculated upon 80% of the recorded pullback back tested past performances
DISCLAIMER: This is a technical analysis study, not an advice or recommendation to invest money on.An intraday high potential, Back Tested Long Analysis.

TTi Detected possible acquisition or asset purchase!!!TTI: tetra technologies
2018-03-01 07:00:14
Detected possible acquisition or asset purchase