TWTR Twitter: New CEO, Now What?Hello friends, today I am completing a technical analysis on the 1D linear scale chart for Twitter Inc ( TWTR ), traded on the NYSE.
#CryptoPickk notes the following:
1) Twitter price has been falling for multiple months after the price met an all time high around $80. It has been supported in the past by a multi-year trendline (in red).
2) Based on the Fibonacci Retracement, the price bounced off of the 0.618 level around $43. Generally at this level, price tends to have a reversal so we may be able to see upside from here.
3) The RSI (relative strength index) is in the oversold territory and about to touch an area where it has reached a few times in its history. From this point, there is usually a bounce.
4) The Stochastic RSI (Stoch RSI) is in the oversold region and looks like it may be forming a double bottom before a move up.
5) The Money Flow Index (MFI) recently formed a double bottom and moving back up.
6) The MACD is still oversold.
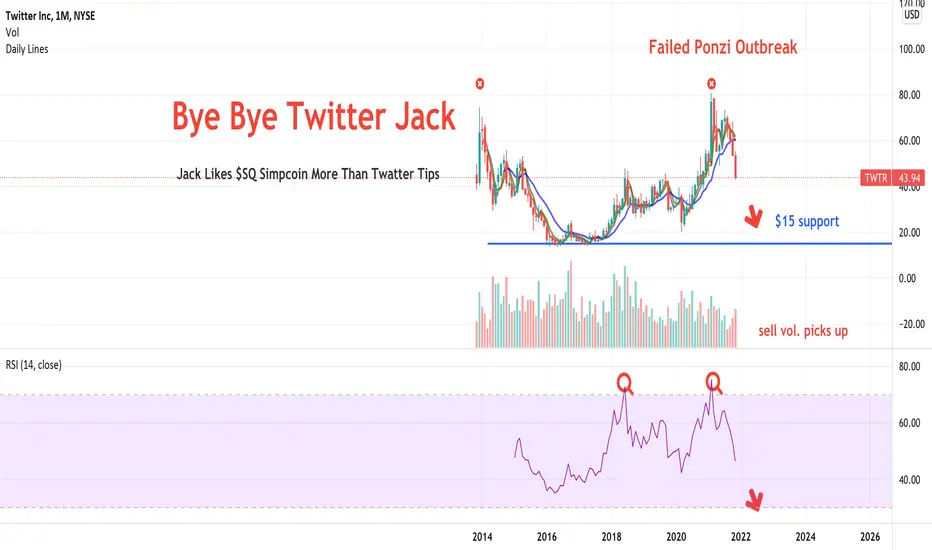
7) The Sell Volume has been significant over the past few weeks but has been decreasing. This may show the Sellers are losing steam.
8) In the news, Jack Dorsey has decided to step down as CEO of Twitter to focus on Square Inc. He will be replaced by the current CTO, Parag Agrawal, who has been with the company for many years.
9) The price has the potential to get back to the $80 price range, which would be a 83%-84% gain. It may come with volatility.
What are your opinions on this?
If you enjoy my ideas, feel free to like it and drop in a comment. I love reading your comments below.
Disclosure: This is just my opinion and not any type of financial advice. I enjoy charting and discussing technical analysis. Don't trade based on my advice. Do your own research! #cryptopickk
TWTR trade ideas

TWTR. REVERSAL, OVERSOLD.Twitter clearly hit targets where it had little to no support and specific take profit lines, reasoning to having this big drop... it wasn't because the CEO stepping down. Anyways back to technicals, we've been in a huge declining trend for about 7 weekly candles. Based on the chart we are about to hit a .886-1 reversal Fib. This doesn't mean that it's a guarantee that it's going to just get sniped and reverse back up, BUT I will say this... we are hitting the bottom of the Bollinger bands, weekly 200ma. and about to enter oversold zone with the RSI. IMO $42-39 has great support and a great spot to DCA. Goodluck.

Twitter should enter price discoveryI have been accumulating a TWTR position.
After the large ABC over multiple years (wave 2) it now consolidated above the correction level. Recently it bounces off the trendline (resistance to support) while forming a hidden bullish divergence on the rsi in weekly timeframe.
The all time chart is showing some kind of inv head and shoulders pattern.
Twitters current market cap is 40b
after it breaks ath it will go into price discovery to find its fair value, similar as TSLA did
Fundamentally Twitters problem has been to monetize their users. But i am bullish that they can do it using newsletters / any premium models similar to onlyfans / livestreaming ads.
The pandemic has showed that to get good information first hand the best way is to use twitter and follow the top scientists over clickbait news articles.
Censorship on twitter has been a bad thing but twitter already working on a decentralized version where the data is hosted decentralized and twitter just becomes the gui to access the data. Therefore they would be less responisble for censoring.
Nothing is without risk but this looks like a great opportunity!
targets are hard to measure once it broke ath and is in pricediscovery, one should think about how to trail stop or find profit target after there are good signals in the chart

STRONG LONG TWITTER social networking service which overtake facebook.
TWITTER and TELEGRA FUTURE social.
Why short was? Twitter's stock trades at roughly 40 times forward earnings. That price-to-earnings ratio makes it more expensive than Facebook, which trades at just 20 times forward earnings, but it's cheaper than Pinterest or Snap.
BUT have new technology unpublic and haven't launched yet. Maybe NFT, Meta i.e.
:DDDD idea is not reinforced concrete

Short TWTRJust an idea and trade at your own risk.
Twitter is in bearish movement after CEO Jack's departure and broke a double top pattern and retested the neckline, its project target is around $29 per share.

Twitter $TWTR Crash - Bye Bye Jack - BUY Volatility $VIXYADVERTISING MODEL PLATFORMS CRASH!!!! The old 2digit tickers they try to run and hide from. Gross. THAT'S WHAT DECENTRALIZATION FIXES. *ADVERTISING*.
Notice Jack is out when $FB zuck changes their business name to META. WE ARE LAUGHING. Never would I ever!!
Everybody has their own coinage at this point. Sorry Jack. Sorry Zuck. No chance. Both have got to stick with #simpcoin & $SQ until the Digi Dollar puts it to rest. They're all echochamber FEE VULTURES. They don't care which crypto you pass around. They take fees from the system. Ponzi Poggers. Storytellers. NOT INVESTMENT WORTHY.
ETHEREUM IS JUST AS GREAT AT $100. OH MY. $10????
#cryptocrash
Go Gary G!!
#kingdollar
Buy $VIXY VOLATILITY
Volatility Boom. Go small caps.
#cannabisreform
$KERN
$MSOS
$PSDN
Cannabis Saves Lives. Federalization #comingsoon
Final Buy Area for me on TWTRThis is the last place that I'm buying now it's time for the reversal. NYSE:TWTR

#TWTR Twitter testing yearly pivot, 61.8 fib and 200ma bandsQuite a big confluence level here on twitter. We have the yearly pivot, 61.8 fib as well as the 200 day ma bands which are all intersecting at these levels. Monitor closely for a bounce to transpire from this oversold chart. Market doesn't seem to have been to happy with the announcement of previous CEO Dorsy stepping down

Twitter seems to be making a 2nd WaveLooks like price is in the middle of a correction, question is when or where this correction will end. Either price can bounce from the lower trendline, reaching the 100% Fib Extension or extend the move to 32$ - 39$.

Twitter Swing PositionI plan to enter Twitter here in the low $40s with a potential DCA in the mid $30s - if reached. Should anticipate $100+ thereafter but cannot identify my targets until we can secure a bottom to this move.

TWTR ZONEBest zone for invest, it's important to split the entry, you can tale the zone or the line for Take Profit.

TWITTER Bullish PatternTWTR formed a bullish BAT pattern.
Very high volume might push the stock to T1 faster than usual.
Watch for indicators to reverse.

$TWTR Watching for 41.57$TWTR Watching for 41.57
Well, that 41.57 target is starting to creep up… I will definitely be buying there…
——————
I am not your financial advisor, but I will happily answer questions and analyze to the best of my ability but ultimately the risk is on you. Check out my ideas, but also do your own due diligence.
I am not a bull. I am not a bear. I just see what I see in the charts and I don’t pay too much attention to the noise in the news.
Very often you have to look at my charts from the perspective of where I’m looking to sell puts. But I also do open positions still once in a while.
If you want me to analyze any stock or ETF just leave me a comment and I’ll do it if I can.
Have fun, y’all!!
(\_/)
( •_•)
/ >🚀


$TWTR Crab Harmonic Formation - DowntrendTwitter price trend is still in ongoing downtrend. Crab formation D point is also dips point.


twtr buy buy at 47.92 .. first target 58.00 .. finally target 65.00 .. stoploss under the support level .

$TWTR - Swing trade with time see testNOTE: NOT FINANCIAL ADVICE AND I AM NOT BUYING WEEKLIES HERE
This is one of my favorite right now. Yes we had an inside day - but I am not targeting this guy as a short term flip. This one is cheap so grab time if you play it.
I am targeting 50-52.5 short term, so 30DTE or so should print nicely
Also note indicators are already showing reversal potential. So inside day break to the upside could trigger the move to 50.
Inside day breakdown and I would stay out until indicators show bullish divergence. BUT WITH TIME ANY DIPS CAN BE COUNT (looking at you commons)

$TWTR may fall further but is attractive at this levelMonthly chart showing $TWTR has spent most of its public life trading below $45. Anchored VWAP (monthly) from IPO till current date is $34.45.
And note that Twitter has spent most of 2021 trying to erase the share price gains of February 2021, one of its best months on record.
However, it's an important media (content delivery) company and has shown the ability to evolve and improve, although slowly.
I'm bullish and realized my bias recently ... when a relative asked me what I thought of the James Webb Telescope. I knew nothing about this topic and immediately searched it on Twitter. now following @NASAWebb among other related accounts on Twitter.
I've long thought Twitter should offer a subscription-based service in addition to their free offering. The recent $2.99 per month idea hopefully evolves with the ability to filter "bot generate" garbage, and provide more content management features.
IMHO ... $TWTR is oversold

Symmetrical Triangle/Broken to the DownsideThis triangle broke to the downside.
This pattern is neutral until a trendline is broken.
To get targets for a triangle, some take the wide end and project it down from the trendline (You can draw a trendline and connect the wide end, then use the magnet to project it down or up). This would give you a 100% target but price can fall to lesser fib levels, or fib extensions of 100%. This triangle was wide at the fat end.
A triangle is like a vacuum, price is squeezed in to the apex and price will break one way or the other. Triangles can be a long term patterns or morph in to another pattern. They are considered a consolidation pattern
No recommendation

TWTR NFT Community Boost For anyone involved in NFT's it is evident that Twitter has become the home base for NFT communication
A community as strong as this one can have an effect on TWTR's value
Each day the NFT community is growing larger, and hence also twitter
From the TA side of things, using these Fibonacci circles it can be seen that 3.618 from an acquired downtrend is acting as a support. A bounce will likely occur of this line and price will start heading upwards, as indicated by the Bars Pattern (in green).

TWTR [LONG] DCAEntry for TWTR from here some key fib support below as charted, but an area i'm happy to start a DCA position here.
** NOT FINANCIAL ADVICE**

TWTR Weekly Options PlayDescription
TWTR remains in extended downtrend that began in FEB of this year. Began broadening formation in August that ended in a breakout to the downside of both the broadening formation and the major trendline that began in MAR of 20'
Long Put
Levels on Chart
SL on a daily close over the lower trendline in the broadening formation. This can happen and a short is still valid, but due to the nature of options this position will be a close-out and search for new entry.
*Stops based off underlying stock price, not mark to market loss
The Trade
BUY
11/12 53P
R/R & Breakevens vary on fill.
Manage Risk
Only invest what you are willing to lose
