U - breakout soon?After hitting the low on 11 May, U traded in a sideway range between 32-48 for almost 3 months now, forming a possible base. The higher volume during this period suggest there could be some accumulation going on.
However with earnings expected out tomorrow, there is a always risk of a nasty surprise.
Hence to be conservative, wait for results to be out.
Should the stock rise after earnings, buy near the break or wait for the first pullback.
Disclaimer: Just my 2 cents and not a trade advice. Kindly do your own due diligence and trade according to your own risk tolerance and don't forget that money management is important! Take care and Good Luck!
U trade ideas

$U -56% DISCOUNT (52-WK) -86%(ATH)!Unity Software is a good stock to have if you are big on software and gaming! it is currently down -56% from its 52-WK High, and down -86% since Nov '21. I see good buying opportunity in the $30-$35 area (Seems like heavy buying pressure started @$33)! A great buying opportunity is anything below $30!

U Unity Software Options Ahead Of EarningsLooking at the U Unity Software options chain, i would buy the $50 strike price calls with
2022-11-18 expiration date for about
$8.70 premium.
Looking forward to read your opinion about it.

U - 2nd AttemptUPDATE ON LAST IDEA:
- So the last failed completely, but I did mention it was completely dependent on market strength.
- This green range that's formed on top of the high that made the lowest low is a really really nice area for it to build strength and push out from.
- Below 31.74 out and wait for a better set up
- Nice knife that formed the range but not getting enough sellers to enter the purple bottom range/base.
- Market strong and this has catching up to do

United we stand!Unity Software
Short Term
We look to Buy at 32.33 (stop at 29.76)
Preferred trade is to buy on dips. Although the anticipated move higher is corrective, it does offer ample risk/reward today. We therefore, prefer to fade into the dip with a tight stop in anticipation of a move back higher. Dip buying offers good risk/reward.
Our profit targets will be 40.85 and 47.19
Resistance: 41.00 / 46.50 / 78.00
Support: 32.00 / 30.00 / 20.00
Disclaimer – Saxo Bank Group. Please be reminded – you alone are responsible for your trading – both gains and losses. There is a very high degree of risk involved in trading. The technical analysis, like any and all indicators, strategies, columns, articles and other features accessible on/though this site (including those from Signal Centre) are for informational purposes only and should not be construed as investment advice by you. Such technical analysis are believed to be obtained from sources believed to be reliable, but not warrant their respective completeness or accuracy, or warrant any results from the use of the information. Your use of the technical analysis, as would also your use of any and all mentioned indicators, strategies, columns, articles and all other features, is entirely at your own risk and it is your sole responsibility to evaluate the accuracy, completeness and usefulness (including suitability) of the information. You should assess the risk of any trade with your financial adviser and make your own independent decision(s) regarding any tradable products which may be the subject matter of the technical analysis or any of the said indicators, strategies, columns, articles and all other features.
Please also be reminded that if despite the above, any of the said technical analysis (or any of the said indicators, strategies, columns, articles and other features accessible on/through this site) is found to be advisory or a recommendation; and not merely informational in nature, the same is in any event provided with the intention of being for general circulation and availability only. As such it is not intended to and does not form part of any offer or recommendation directed at you specifically, or have any regard to the investment objectives, financial situation or needs of yourself or any other specific person. Before committing to a trade or investment therefore, please seek advice from a financial or other professional adviser regarding the suitability of the product for you and (where available) read the relevant product offer/description documents, including the risk disclosures. If you do not wish to seek such financial advice, please still exercise your mind and consider carefully whether the product is suitable for you because you alone remain responsible for your trading – both gains and losses.

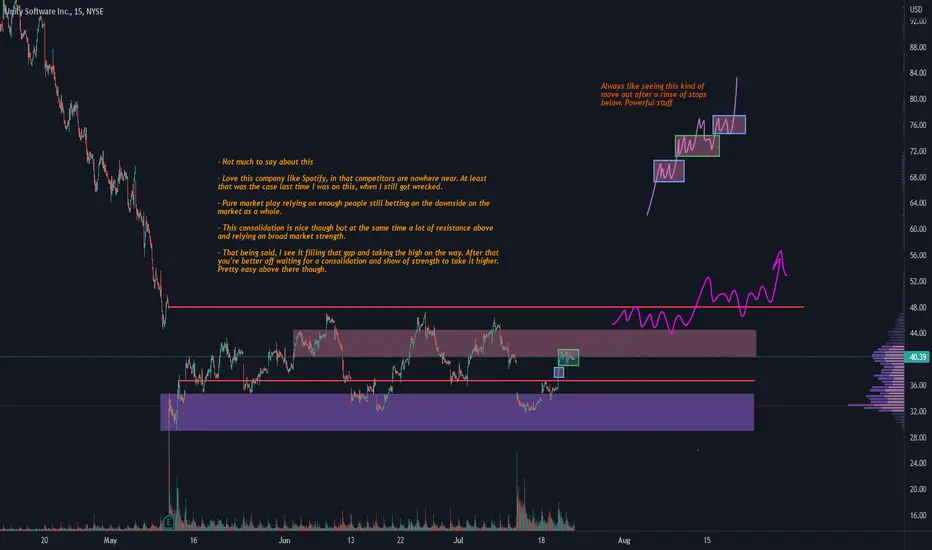
Unity (U) - Looks like its setting up but all depending- Not much to say about this
- Love this company like Spotify, in that competitors are nowhere near. At least that was the case last time I was on this, when I still got wrecked.
- Pure market play relying on enough people still betting on the downside on the market as a whole.
- This consolidation is nice though but at the same time a lot of resistance above and relying on broad market strength.
- That being said, I see it filling that gap and taking the high on the way. After that you're better off waiting for a consolidation and show of strength to take it higher. Pretty easy above there though.
50% profit on Unity
Check this out, nice and smooth a great signal in tough times.
Reached the bottom right now.
Bought recently by the big boss, with a very small risk of loosing your capital.
No need for other comments.
Damn, I am proud of me XD
Be wise don´t work for money, make money work for you.

U daily+ Oversold
- Below all moving averages
- Below key zones
Box play, won't do anything until this range is broken.

U weekly+ Bullish divergence
- Below all key moving averages
Dont jump in early on that one, wait until the box break.

Unity Long - Swing trade with risk/reward ratio of 1.98Yesterday, Unity ($U) shares plummeted 17.45% after the release of news that they were acquiring ironSource ($IS) for $4.4B.
The NDO 50 indicator on the bottom was green for the day, showing that there was an incredibly abnormal volume yesterday. Interestingly, despite this large selling volume, the short volume was actually fairly low for the day, as shown by the NDO 50 indicator with the short volume being red.
To me, this suggests that while a whale exited their position yesterday, causing the large volume, as if the market viewed this event as bearish, shorting volume should theoretically have increased, while in reality it decreased.
Additionally, there is a strong support around the 32 level for the 15 minute and 1 hour charts, which around the current price of $U. Around this level, there were multiple bullish engulfings yesterday on the 15 min timeframe, and one doji on the daily chart, confirming this support and showing that there is potential for a bullish reversal to fill the gap created yesterday.
My pivot levels indicator shows that the current price is at a strong pivot level, and the nearest pivot on the upside is around 40, so its fair to say that this trade has a large upside.

$U Potential Bullish signals targeting 49.5/54.2/61.2 SL 38.5Bullish close for 2nd day above down trendline but facing big cloud resistance - if it can take previous top above 47 then targets 49.5-54.2-61.2 for short term lets say 2 weeks with important stoplosss below 38.5 .. if broke down SL then possible to see 50% discount at 23 .. not likely but possible .. long term goal at 78 and 92 which is double current price close at 45.23 .. Gl .. The idea is to strangle or straddle options with base at 45 - its good risk/return ratio .

$U with a Bearish outlook following its earnings #Stocks The PEAD projected a Bearish outlook for $U after a Negative Under reaction following its earnings release placing the stock in drift D.

UNITY (U) DOWNTREND INTACTUNITY (U) DOWNTREND INTACT
Unless the sloping Red TL is broken, no change in trend

Head and Shoulders/Flags Versus PennantsU has fallen from an ugly top and bear flags/pennants have formed on the way down. Unity fell from a prior head and shoulders and recovered. That was then.
The all time low was recently made which is slightly lower than the IPO price of 65.11. I am often leery of stocks this close to the point of having no support. IPOs can be great until price goes below the low, as new support will need to be formed.
U has reached the target of the last Bear Pennant as demonstrated using the pole and projecting it downward. A pennant usually has both trendlines sloping up and converging and looks similar to a rising wedge. Flags and pennants are known as continuation patterns. They are typically seen right after a large, quick move to the upside or the downside. If the move is slow and ranging in areas, it is probably not a Flag or a Pennant. Bullish flags are characterized by lower tops and lower bottoms, with the pattern slanting against the trend. But unlike wedges, their trendlines run parallel. Bearish flags are comprised of higher tops and higher bottoms. "Bear" flags also have a tendency to slope against the trend. Pennants are typically smaller in size and formation.
U has broken the neckline a while back of the H&S pattern. A fall of 100% is marked with a white dashed line but this is just a guesstimate. This pattern can fall less or more than 100%.
Finding the neckline can sometimes be tricky and sometimes they are easy to see. Before a break down through the neckline, there may be evidence of a struggle to stay above the support of the neckline. After price falls through it, if it does as any pattern can fail, the neckline becomes resistance and you may see a resistance struggle at this level. This pattern has a higher failure rate in a bull market.
If U falls below it's most recent low of 64.14, I would consider shorting this.
No recommendation.
It is hard to learn from your mistakes if you do not know what you are doing wrong )o:

Unity long Pt 87, 107, 127, 157Strong support level
Small stop 73.1
PT 1 87
PT 2 107
PT 3 127
PT 4 157


Unity +300% UpwardsHi Traders,
Unity being (one of the) wheels for an upcoming VR&AR revolution, this stock might be trading around 3x to it's current price in few years (maybe next).
An expanding triangle (megaphone) pattern suggests we are at the lower band now which is a good entry for buying opportunity. We might see some pressure at 160-170 which is 61,8 FIB and a DEC 20resistance level. Short opportunity is waiting there.
Good luck.
TONY

18/4/2022 NYSE (U)Short (Entry Price) below the black line and exit (Stop Loss) above the red line. Can take profit at the suggested Target Price.
Entry Price: $90.99
Target Price: $86.50
Stop Loss: $95.46

U is looking very bullish 30% in next 40 days if broken necklineU is showing a inverted head and shoulders pattern and is at old support. I expect it to go up 30% in the next 40 days if it breaks the neckline

$U Unity Trade Idea with Entry, Possible Targets, and StopLoss!Hi Traders,
Here's my Trade Idea for UNITY, after a good V shape reversale, followed by Downtrend Breakout, and not too bad Momentum, I think if it breaks the 105.9 level, it may reach the mentioned targets.
Buy Stop 105.9$
STOPLOSS 91$
Targets:
127$
136$
156$
Nfa, DYOR, and good Luck.
Let me know what do you think in the comments!

Time to play some UnityHello Friends!
It’s been a nice move from the bottom for Unity, congrats to the profit takers. From this point I think there are two ways to play this.
Option#1: Looks like a rising wedge will play out to pull back to $93 support before the next move up to $125.
Option#2: If it moves up to $108 and pulls back to $105, $125 might be in play.
As always thanks for your follows, likes, and comments. Let’s learn and grow together. Cheers!
*This information and publication is not meant to be, and do not constitute, financial, investment, trading, or other types of advice. Do your own research.

Unity to Move Lower?Unity Software - Short Term - We look to Sell at 101.55 (stop at 109.41)
Preferred trade is to sell into rallies. Prices expected to stall near trend line resistance. 50 1day EMA is at 103.50. Our overall sentiment remains bearish looking for lower levels.
Our profit targets will be 74.13 and 67.10
Resistance: 100.00 / 120.00 / 135.00
Support: 90.00 / 70.00 / 50.00
Disclaimer – Saxo Bank Group. Please be reminded – you alone are responsible for your trading – both gains and losses. There is a very high degree of risk involved in trading. The technical analysis, like any and all indicators, strategies, columns, articles and other features accessible on/though this site (including those from Signal Centre) are for informational purposes only and should not be construed as investment advice by you. Such technical analysis are believed to be obtained from sources believed to be reliable, but not warrant their respective completeness or accuracy, or warrant any results from the use of the information. Your use of the technical analysis, as would also your use of any and all mentioned indicators, strategies, columns, articles and all other features, is entirely at your own risk and it is your sole responsibility to evaluate the accuracy, completeness and usefulness (including suitability) of the information. You should assess the risk of any trade with your financial adviser and make your own independent decision(s) regarding any tradable products which may be the subject matter of the technical analysis or any of the said indicators, strategies, columns, articles and all other features.
Please also be reminded that if despite the above, any of the said technical analysis (or any of the said indicators, strategies, columns, articles and other features accessible on/through this site) is found to be advisory or a recommendation; and not merely informational in nature, the same is in any event provided with the intention of being for general circulation and availability only. As such it is not intended to and does not form part of any offer or recommendation directed at you specifically, or have any regard to the investment objectives, financial situation or needs of yourself or any other specific person. Before committing to a trade or investment therefore, please seek advice from a financial or other professional adviser regarding the suitability of the product for you and (where available) read the relevant product offer/description documents, including the risk disclosures. If you do not wish to seek such financial advice, please still exercise your mind and consider carefully whether the product is suitable for you because you alone remain responsible for your trading – both gains and losses.

UNITY BUYTime to buy this stock?
If Answer is yes,then hold it for next 5 to 10 years.
Trade with Care
