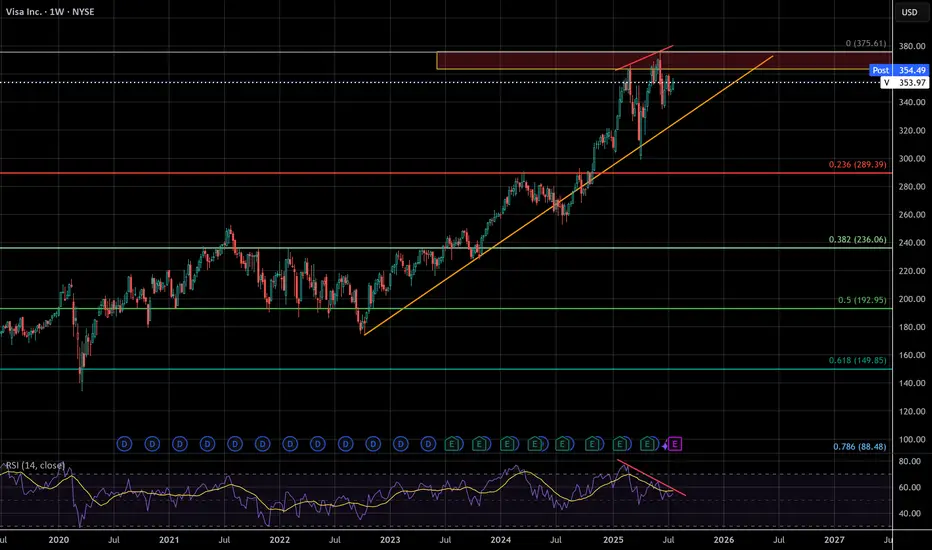
Visa: Waiting in the Wings Visa has entered a phase of sideways consolidation — but this does not affect our primary scenario. We continue to see the stock moving within magenta wave , which is expected to complete the larger turquoise wave 4 inside our turquoise Target Zone between $308.09 and $292.19. After that, we anticipate a renewed upward impulse. Turquoise wave 5 should then push the stock beyond the resistance levels at $375.51 and $394.49. Meanwhile, we are keeping two alternatives on our radar. The first has a 35% probability and assumes the correction is already over, meaning turquoise wave alt.4 is complete. The second is a more bearish scenario (32% probability) visible on the daily chart. It suggests that the high of green wave alt. may already be in, which would imply that the ongoing alt. wave is headed toward a lower low below the $234.30 support level.
📈 Over 190 precise analyses, clear entry points, and defined Target Zones - that's what we do (for more: look to the right).
V trade ideas

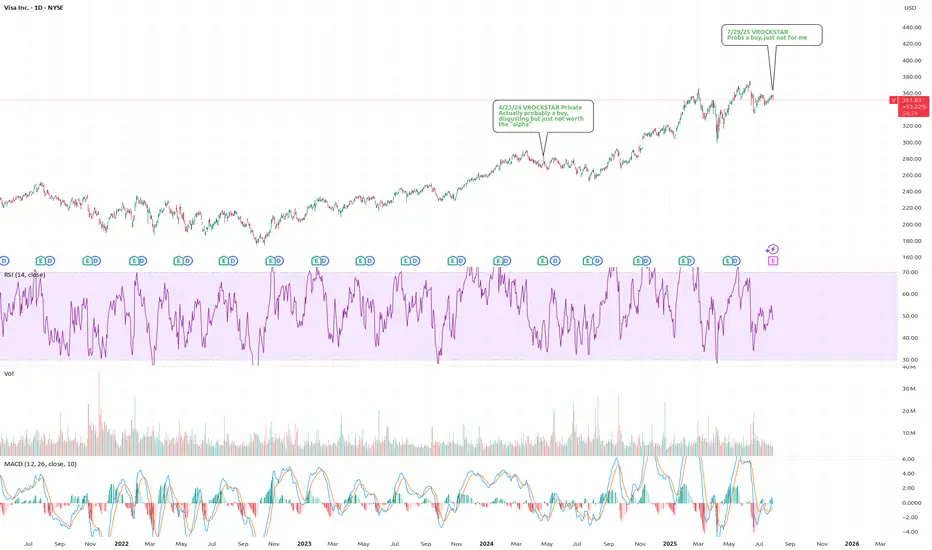
7/29/25 - $v - Probs a buy, just not for me7/29/25 :: VROCKSTAR :: $V
Probs a buy, just not for me
- over 3% fcf yields, growing, consumer spending well
- over time (probably long duration) I think the biz model probably gets eroded, but also mgmt has done a nice job evolving, perhaps they keep up with the times etc.
- don't think anything is broken here
- all else equal a nice barometer for the consumer names in my portfolio (deck, lulu)
- i'd guess stock is higher on this print
- just have too many other things going on to play this $666 bn EV
V
VISA - The missing puzzle piece - Suffering from successI've seen a lot of negative sentiment online lately about the impending bubble, but even with social media, crude AI, and the US dollar being the peak of that negativity this whale has been dying slowly and few have taken notice.
VISA has begun to censor what can be bought, overcharge merchants, and short change banks on interchange fees. These are acts of desperation as growth reaches diminishing returns, the beginning decline of a massive company. Think about it, who isn't using visa already? They have to wait for new users to be born. There will only ever be more competition, competition that has superior speed, accuracy, efficiency, and cost.
VISA may not lead this crash, but it's days look to be numbered unless they make radical changes . According to google results, antitrust violations can carry 3 times the monetary penalty gained from illegal activity. I don't think this will happen, but it's a TON of leverage for a massive settlement. The cracks are just beginning, but this company is made of glass
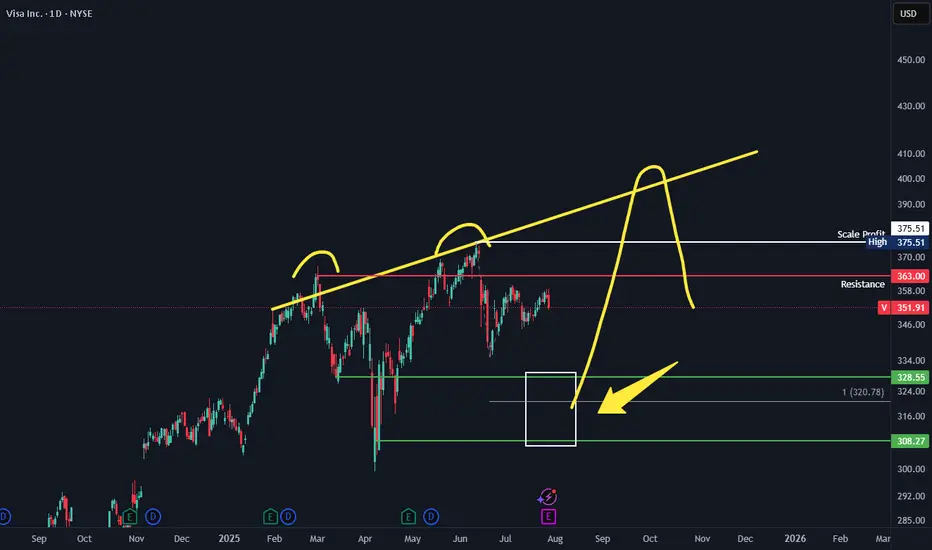
VISA 3 peaks and a dump. Should VISA pullback to the lower support zone. Look to swing long back to ATH with the big target of around 400 where 1 can look to swing short. The typical 3 peaks and a dump setup.
betting that $V jumps up to the gap this weekVisa is just taking a breather before its next vacation to the upper Bollinger Bands, so get ready to profit from its upward journey with a strategically placed call spread

V will be joining crypto soon... BULLISH UPSIDETechnical Analysis: Visa Inc. (V) – Thesis: V will integrate cryptocurrency in the near future.
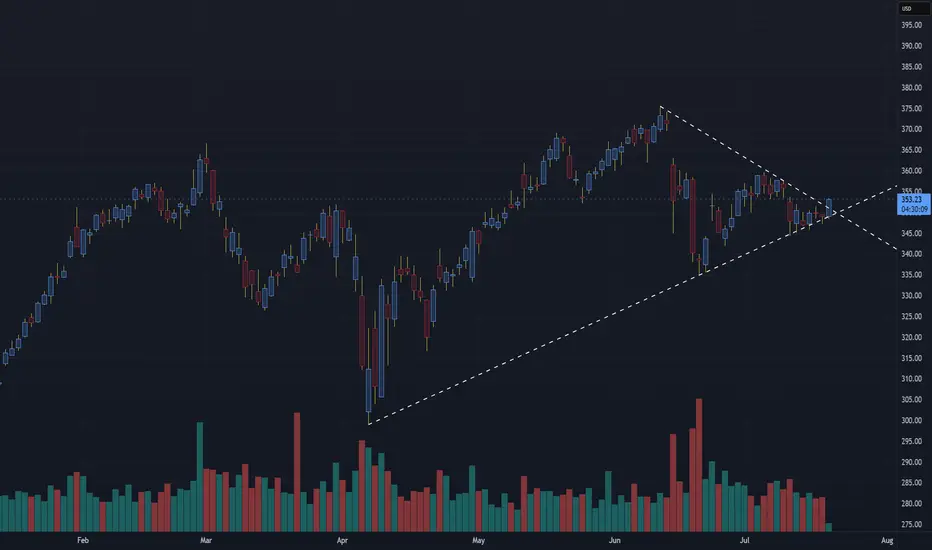
The chart shows a symmetrical triangle pattern forming on Visa Inc. (V), which is a consolidation pattern often leading to a breakout in the direction of the prevailing trend — which in this case, has been bullish since the April lows.
Bullish Case
Breakout Confirmation: Price has now broken out above the descending resistance of the triangle (~$350) and is trading at $353.27. This breakout is being accompanied by moderately increasing volume, which is a positive signal for confirmation.
Rising Trendline Support: The ascending trendline from the April lows continues to hold, supporting the broader uptrend.
Next Key Resistance Levels:
$360 – Local consolidation and horizontal resistance level
$375 – Previous swing high from mid-June
$390–395 – All-time high resistance zone
Stop Loss Levels
Aggressive Stop: Below the breakout candle low (~$348)
Conservative Stop: Below ascending trendline and prior swing low support (~$342)
Hard Stop: Break below $338 would invalidate the triangle pattern and signal trend weakness.
Risks
Slower global consumer spending or recessionary pressures
Regulatory risk (especially around interchange fees)
Competition from fintech disruptors (though Visa is often a partner to them)
Summary: Bullish Thesis on Visa (V)
Technical: Breakout from symmetrical triangle backed by volume and strong trendline support
Target: $375 → $390 → $405+
Stop-Loss: Tight at $348, looser at $342 or $338
Fundamental: Strong earnings power, dominant market share, resilient cash flow, and secular tailwinds from digital payments
If price holds above the breakout level and the volume stays supportive, Visa may be setting up for a sustained run toward all-time highs into Q3 earnings.
VISA on a strong Bullish Leg targeting $440.Visa Inc. (V) has been trading within a Channel Up pattern since the October 10 2022 market bottom. After December 2022, every test of the 1W MA50 (blue trend-line) has been the most optimal long-term buy opportunity, being also a Higher Low (bottom) of the pattern.
Every Bullish Leg has been +5% stronger than the previous, which leads us to believe that the current Bullish Leg will peak at around +49.50% (+5% from +44.60%). This translates to $440 Target towards the end of the year.
-------------------------------------------------------------------------------
** Please LIKE 👍, FOLLOW ✅, SHARE 🙌 and COMMENT ✍ if you enjoy this idea! Also share your ideas and charts in the comments section below! This is best way to keep it relevant, support us, keep the content here free and allow the idea to reach as many people as possible. **
-------------------------------------------------------------------------------
💸💸💸💸💸💸
👇 👇 👇 👇 👇 👇

VISA GAP FILL INCOMING$V overhead gap at $369 ready to be filled.
A weekly candle close over 370 is necessary to see a new all-time high.
A breakout and retest of the top trendline is necessary to see 400+.
The script is written. It is inevitable.
-READ THE CHARTS 7/5/25

VISA Further Downside
I am expecting further downside for V, based on:
Bearish RSI divergence on recent top (on 4H and Daily timeframes)
Lack of Bullish RSI divergence on recent low
Strong volume on downside, smaller volume on upside
The 1st target is green support zone around 320.

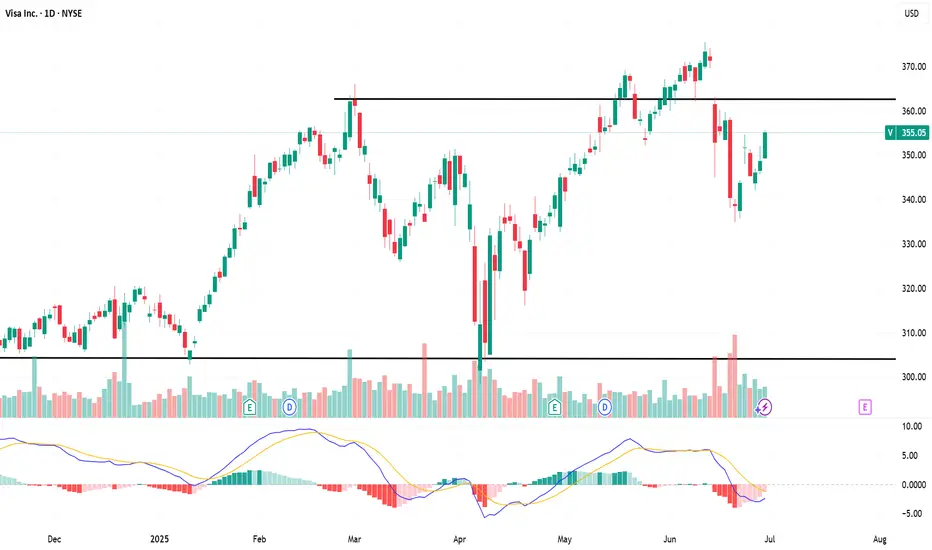
$V – Approaching 362 ResistanceVisa is rebounding after a sharp drop triggered by the announcement of the Genius Act, now approaching the 362 zone — a key resistance level from previous highs. Let’s see how it plays out.
Visa Wave Analysis – 19 June 2025
- Visa broke daily up channel
- Likely to fall to support level at 332.90
Visa recently broke the support zone located between the support level 345,00 (which reversed the price earlier this month) and the 38.2% Fibonacci correction of the upward impulse from the start of April.
The breakout of this support zone coincided with the breakout of the daily up channel from April – which accelerated the active wave 4.
Visa can be expected to fall to the next support level at 332.90 (former minor support from April and the target for the completion of the active wave 4).

Visa: Resistance ApproachingThe next key step for Visa should be overcoming resistance at $394.49 during magenta wave . However, if support at $339.61 fails to hold, our alternative scenario (33% probability) will be activated—suggesting the recent high already marked the end of the corrective wave alt. in magenta. In that case, a renewed decline below the $299 mark would be likely, aiming to complete the alternative turquoise wave alt.4 on a larger scale.
📈 Over 190 precise analyses, clear entry points, and defined Target Zones - that's what we do.

VISA - A Pump & Dump? Help me understand please.To places where no stock price has ever gone before..
What makes VISA so special?
The credit industry is currently staring into the abyss due to massively rising payment defaults.
Why is VISA skyrocketing in price, breaking through every barrier as if they were made of butter?
I don't know, and I'm very puzzled.
What will happen if economic conditions become even more difficult and the madness we're currently experiencing fully hits, and hardly anyone can service their consumer debt anymore?
I think at that point, VISA will look like a
Pump & Dump too like many others.
I'd appreciate any info on why VISA is rising so much.

VISA cup and handleCup and handle patterns are all over the place right now. Visa is another name that is showing this pattern forming on the daily chart. A strong move in financial names could push this over 369.15 towards new highs.

Strategic Entry in Visa (V): Stability, Growth, and Opportunity📈 Strategic CALL Entry on VISA (V) – All 20 Criteria Met
Today I’m entering a CALL option on Visa (V) based on a comprehensive analysis that aligns with all of our 20-entry criteria, combining technical indicators, fundamental strength, and disciplined risk management.
But beyond that, we are also factoring in key macroeconomic catalysts and upcoming earnings, which strengthen the setup and give us a clear path for growth.
🔍 Why Visa – and why now?
✅ Meets all 20 internal criteria, including:
Price above both the 50- and 200-day moving averages (clear uptrend)
RSI in a healthy range (not overbought)
Volume confirms price action
Consistent earnings performance
Strong sector momentum (payments & fintech)
Sound risk-to-reward structure (<6% of portfolio risk)
Positive analyst sentiment
Solid balance sheet, low debt, global dominance, etc.
📊 Earnings expected in June
Visa is set to report earnings in June. Forecasts suggest strong performance backed by increasing digital transactions and resilient global spending. A positive surprise could trigger a sharp upward move.
🌍 Macroeconomic backdrop: US GDP data out today at 8:30 AM (EST)
GDP expectations stand at +2.2%. If confirmed, it signals continued economic strength — a bullish sign for consumer-facing companies like Visa that benefit directly from transaction volume growth.
💡 Why Visa stands out:
Stability
Steady growth
Low volatility
Strong technical and fundamental alignment
📌 Bottom line:
Visa not only checks all our boxes internally, but also benefits from a favorable macroeconomic context and key catalysts ahead. This is a high-conviction, low-emotion trade backed by structure, not hype.
Visa Challenge Resistance at $362Visa is one of the greatest companies, with a solid business model and a profit margin of 50%.
The stock has hit resistance at $362 and is currently testing that level. If the share price breaks above it, we could see a continued uptrend to new highs. However, if it fails to break out, a pullback might be expected.

"King of Cards" How Does Visa Make Money?NYSE:V
To be honest, VISA stock is the kind of investment that really feels solid and reliable. I bought a bit of VISA a few years ago, and before I knew it, the price had climbed past $300 and I started getting those occasional dividend notifications. The dividends aren’t huge, but it’s nice to see that money coming in automatically. I can see why so many dividend investors like VISA.
VISA is, of course, the same “VISA” you see on your credit cards. Globally, they dominate the credit card market, with nearly half of the market share, and they’re among the top 10 biggest companies in the US by market cap.
These days, cashless payments have become the norm, and that trend really works in VISA’s favor. Most analysts expect VISA to keep growing steadily, with annual revenue and profit increases of around 10%. VISA has also raised its dividend every year for over 16 years, making it a classic “dividend growth” stock. The yield itself is under 1%, but the key is that the dividend keeps getting bigger.
Recently, VISA’s been expanding into new businesses too-like Visa Direct for money transfers-so they’re evolving from just a credit card company into a global payments platform. Maybe that’s why even Warren Buffett has invested in VISA.
Of course, there are risks. There’s always talk of antitrust regulation, and new fintech companies like PayPal are trying to take market share. In fact, VISA’s stock has underperformed the market a bit in the last few years. But VISA’s economic moat (the barriers that keep competitors out) is still very strong.
Looking at the current price, VISA’s P/E ratio is actually a bit lower than its five-year average, so some people think it’s undervalued right now. That’s why I think VISA is a stock you can hold in your portfolio for the long term and feel pretty comfortable about.
- VISA is the clear leader in global payments, and as we move toward a cashless society, its growth prospects look strong.
- The dividend is small but growing every year, and the stock price has trended upward over the long term.
- There are risks like regulation and fintech competition, but most still see VISA as a solid investment.
Maybe you like this Video deal with VISA
below comment!

V | Waiting for Dip | Extended Price | (May 2025)V | Waiting for Dip | Extended Price | (May 2025)
1️⃣ Insight Summary
Visa has been on a strong long-term uptrend and continues to deliver solid financials. However, current price levels seem a bit stretched, and I'm looking for a better risk-reward entry zone.
2️⃣ Trade Parameters
Bias: Long (on pullback)
Entry Zone (Watchlist): $300 – $275
Stop Loss (if entered): Below $251
TP1: $295 (first bounce zone)
TP2: $322
Final Target: $346
Partial Exits: TP1 for early profits, TP2 and beyond for longer-term hold.
3️⃣ Key Notes
💰 Visa posted strong earnings ($2.80 EPS) and impressive revenue ($35B), with a solid net income margin.
🏦 The company benefits from its tight integration with the banking system and steady cash flow (~ SEED_TVCODER77_ETHBTCDATA:4B ).
📉 Debt is manageable at FWB:20B , and Beta at 0.72 shows less volatility than the market—ideal for steady investors.
⚠️ Despite these positives, price looks extended, and I’d prefer a pullback toward $300 or $275 before considering an entry.
📊 Technically, there are signs of a possible bearish divergence forming—this supports the idea of waiting for a better level.
4️⃣ Follow-up Note
Visa remains on my radar, but no trade until we see a clearer technical pullback or structure reset near my ideal buy zone.
Please LIKE 👍, FOLLOW ✅, SHARE 🙌 and COMMENT ✍ if you enjoy this idea! Also share your ideas and charts in the comments section below! This is the best way to keep it relevant, support us, keep the content here free and allow the idea to reach as many people as possible.
Disclaimer: This is not financial advice. Always conduct your own research. This content may include enhancements made using AI.

VISA:Respecting the 61.8% Fibonacci Level and Going for New HighWho doesn't know VISA? Almost everyone has or has had a VISA card. VISA stock has an unbeatable bullish outlook, which, like all stocks on the stock market, has retraced its rise.
---> What is its current situation?
If we look at the chart, its appearance is CLEARLY BULLISH (Bull), having gone through a retracement phase. The retracement it has made is EXACTLY THE 61.8% Fibonacci, AND IT HAS RESPECTED IT. Since reaching that retracement on March 14, the price has not stopped rising. It is currently BREAKING KEY ZONES to initiate an attack on NEW HIGHS IN VALUE. If it surpasses the 352 zone, it will go directly to the highs, and will most likely break them to explore new prices for the stock.
--------------------------------------
Strategy to follow:
ENTRY: We will open two long positions if the H4 candle closes above 352.
POSITION 1 (TP1): We close the first position in the 366 zone (+4%) (highs zone).
--> Stop Loss at 336 (-4.2%).
POSITION 2 (TP2): We open a Trailing Stop position.
--> Initial trailing stop loss at (-4.2%) (coinciding with the 336 level of position 1).
--> We modify the trailing stop loss to (-1%) when the price reaches TP1 (366).
-------------------------------------------
SET UP EXPLANATIONS
*** How do I know which two long positions to open? Let's take an example: If we want to invest €2,000 in the stock, we divide that amount by 2, and instead of opening one position of €2,000, we'll open two positions of €1,000 each.
*** What is a Trailing Stop? A Trailing Stop allows a trade to continue gaining value when the market price moves in a favorable direction, but it automatically closes the trade if the market price suddenly moves in an unfavorable direction by a specified distance. This specified distance is the trailing Stop Loss.
--> Example: If the trailing Stop Loss is at -1%, it means that if the price drops by -1%, the position will be closed. If the price rises, the Stop Loss also rises to maintain that -1% during increases. Therefore, the risk decreases until the position enters a profit. This way, you can take advantage of very strong and stable price trends, maximizing profits.

VISA: One of the steadiest 2025 stock picks.Visa remains bullish on 1W and is about to do so on its 1D technical outlook as well (RSI = 54.200, MACD = 1.140, ADX = 29.207). The 1W Channel Up is what keeps the long term trend bullish and 1D is just recovering from neutral grounds the correction of March's first 2 weeks. This is nothing new for the stock as it had the same -9% correction in September 2023 after a symmetric +43.28% bullish wave. After this correction, the index extended the rally to the 1.382 Fibonacci extension before the stronger correction.
You can see that the 1W RSI pattern now is identical to then. Consequently, we again expect a technical rebound to the 1.382 Fib extension either at or over the 2 year Channel Up (TP = 419.00) by the end of the year.
See how our prior idea has worked out:
## If you like our free content follow our profile to get more daily ideas. ##
## Comments and likes are greatly appreciated. ##

Visa ABCPrice looks like it´ll go for a classic ABC pattern.
This thesis is supported by bearish RSI divergence on the top, lack of divergence on the bottom, and impulsive/corrective patterns for A/B respectively.
First target is 100% extension at 311.46.

Free Report #1:How To Build A Solid WatchlistFinding this chart pattern took about two days.
First i had to create a screener to find the momentum
then today i looked at the watch list.
While looking at the watchlist i tried to screen
for a candle stick pattern,
This candlestick pattern is called the lower long shadow.
It is part of another chart pattern called the frying pan
bottom.
This means the chart price has hit higher new low
as you can see from the drawing on the chart
that looks like a triangle
ALso remember that on this chart is
a technial analysis system called
the rocket booster strategy.
Check out the references to learn about this
strategy.
Also take note of one the best osicllators
in technical analysis called the MACD
look close you will see two lines Crossing
This is rare sight to behold
and this is why i have to document this
and share it with you as well
Trade safe.
Rocket boost this content to learn more
Disclaimer: Trading is risky please learn risk management
and profit taking strategies.Also feel free
to use a simulation trading account before you
trade with real money

Visa: Bottom Already Established?Visa might have already reached the low of the magenta wave ; however, for now, we allow slightly more room for the downside. Nonetheless, once this interim correction has concluded, the price should proceed higher during the magenta wave and surpass the resistance at $366.34. We currently consider it 34% likely that the stock will break above this level to form a fresh high with the magenta wave alt. . But primarily, we view the regular wave as already complete.
