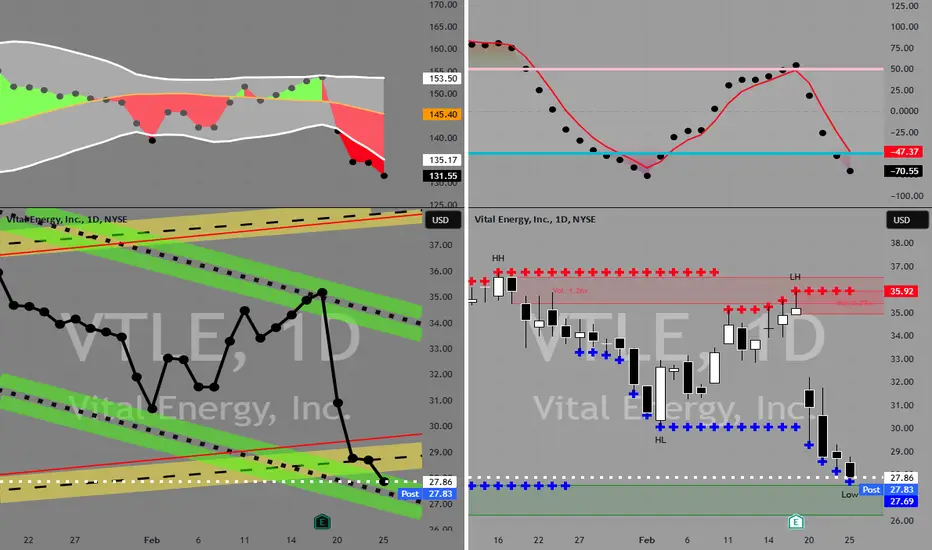
VTLE in Buy ZoneMy trading plan is very simple.
I buy or sell when:
* Price tags the top or bottom of parallel channel zones
* Money flow spikes beyond it's Bollinger Bands
* Price at Fibonacci levels
So...
Here's why I'm picking this symbol to do the thing.
Price in buying zone at bottom channels
Stochastic
Next report date
—
Report period
—
EPS estimate
—
Revenue estimate
—
−3.34 USD
−173.52 M USD
1.95 B USD
29.91 M
About Vital Energy, Inc.
Sector
Industry
CEO
Mikell Jason Pigott
Website
Headquarters
Tulsa
Founded
2006
FIGI
BBG000DZCFX4
Vital Energy, Inc. engages in the exploration, development and acquisition of oil and natural gas properties in the Permian Basin of West Texas. The company was founded by Randy A. Foutch in October 2006 and is headquartered in Tulsa, OK.
Related stocks
VTLE/USD – 30-Min Long Trade Setup!📌 🚀
🔹 Asset: VTLE (Vital Energy, Inc.)
🔹 Timeframe: 30-Min Chart
🔹 Setup Type: Bullish Reversal Trade
📌 Trade Plan (Long Position)
✅ Entry Zone: Above $21.83 (Breakout Confirmation)
✅ Stop-Loss (SL): Below $20.59 (Invalidation Level)
🎯 Take Profit Targets:
📌 TP1: $23.80 (First Resistance Level)
📌 T

Go back to the shaded area for consistencyWith 41% insiders, 23% shorts, and institutions 60%, it has a rating of 50; I would be close to seeing a reversal candle and some good news for a retrieve.

VTLE | InformativeNYSE:VTLE
Analysis of Vital Energy Inc. (VTLE)
Current Status
Price: $44.32
Moving Averages: The stock is trading below its long-term moving averages, indicating a bearish trend.
Bullish Scenario
Bullish Trigger Line: $44.62
Confirmation: A break and close above $44.62 could signal a potenti

VTLE 3d Chart Q2 2024VTLE, has been accumulating after bottoming a few years ago and recently broke out of the down channel of the last 1.5 years.
If the recent moves in the oil and energy sector continue, this has room to run. If this continues, I would like to see it retest the 62-63 zone successfully and hold it co

VTLE: Potential BuyPotential inverse head and shoulders pattern forming. Also coming to retest the major support area.

See all ideas
Summarizing what the indicators are suggesting.
Neutral
SellBuy
Strong sellStrong buy
Strong sellSellNeutralBuyStrong buy
Neutral
SellBuy
Strong sellStrong buy
Strong sellSellNeutralBuyStrong buy
Neutral
SellBuy
Strong sellStrong buy
Strong sellSellNeutralBuyStrong buy
An aggregate view of professional's ratings.
Neutral
SellBuy
Strong sellStrong buy
Strong sellSellNeutralBuyStrong buy
Neutral
SellBuy
Strong sellStrong buy
Strong sellSellNeutralBuyStrong buy
Neutral
SellBuy
Strong sellStrong buy
Strong sellSellNeutralBuyStrong buy
Displays a symbol's price movements over previous years to identify recurring trends.
LPI5654244
Vital Energy, Inc. 9.75% 15-OCT-2030Yield to maturity
12.05%
Maturity date
Oct 15, 2030
LPI5220864
Vital Energy, Inc. 7.75% 31-JUL-2029Yield to maturity
11.55%
Maturity date
Jul 31, 2029
SNYX5773820
Vital Energy, Inc. 7.875% 15-APR-2032Yield to maturity
11.14%
Maturity date
Apr 15, 2032
LPI5773819
Vital Energy, Inc. 7.875% 15-APR-2032Yield to maturity
7.45%
Maturity date
Apr 15, 2032
See all VTLE bonds
Frequently Asked Questions
The current price of VTLE is 17.88 USD — it has increased by 3.44% in the past 24 hours. Watch Vital Energy, Inc. stock price performance more closely on the chart.
Depending on the exchange, the stock ticker may vary. For instance, on NYSE exchange Vital Energy, Inc. stocks are traded under the ticker VTLE.
VTLE stock has risen by 10.45% compared to the previous week, the month change is a −0.89% fall, over the last year Vital Energy, Inc. has showed a −60.66% decrease.
We've gathered analysts' opinions on Vital Energy, Inc. future price: according to them, VTLE price has a max estimate of 49.00 USD and a min estimate of 9.00 USD. Watch VTLE chart and read a more detailed Vital Energy, Inc. stock forecast: see what analysts think of Vital Energy, Inc. and suggest that you do with its stocks.
VTLE reached its all-time high on Nov 5, 2013 with the price of 692.00 USD, and its all-time low was 6.60 USD and was reached on Mar 30, 2020. View more price dynamics on VTLE chart.
See other stocks reaching their highest and lowest prices.
See other stocks reaching their highest and lowest prices.
VTLE stock is 6.75% volatile and has beta coefficient of 1.61. Track Vital Energy, Inc. stock price on the chart and check out the list of the most volatile stocks — is Vital Energy, Inc. there?
Today Vital Energy, Inc. has the market capitalization of 733.49 M, it has increased by 10.93% over the last week.
Yes, you can track Vital Energy, Inc. financials in yearly and quarterly reports right on TradingView.
Vital Energy, Inc. is going to release the next earnings report on Aug 6, 2025. Keep track of upcoming events with our Earnings Calendar.
VTLE earnings for the last quarter are 2.37 USD per share, whereas the estimation was 2.19 USD resulting in a 8.14% surprise. The estimated earnings for the next quarter are 1.82 USD per share. See more details about Vital Energy, Inc. earnings.
Vital Energy, Inc. revenue for the last quarter amounts to 512.18 M USD, despite the estimated figure of 533.70 M USD. In the next quarter, revenue is expected to reach 480.09 M USD.
VTLE net income for the last quarter is −18.84 M USD, while the quarter before that showed −359.39 M USD of net income which accounts for 94.76% change. Track more Vital Energy, Inc. financial stats to get the full picture.
No, VTLE doesn't pay any dividends to its shareholders. But don't worry, we've prepared a list of high-dividend stocks for you.
As of Jul 15, 2025, the company has 405 employees. See our rating of the largest employees — is Vital Energy, Inc. on this list?
EBITDA measures a company's operating performance, its growth signifies an improvement in the efficiency of a company. Vital Energy, Inc. EBITDA is 1.24 B USD, and current EBITDA margin is 62.27%. See more stats in Vital Energy, Inc. financial statements.
Like other stocks, VTLE shares are traded on stock exchanges, e.g. Nasdaq, Nyse, Euronext, and the easiest way to buy them is through an online stock broker. To do this, you need to open an account and follow a broker's procedures, then start trading. You can trade Vital Energy, Inc. stock right from TradingView charts — choose your broker and connect to your account.
Investing in stocks requires a comprehensive research: you should carefully study all the available data, e.g. company's financials, related news, and its technical analysis. So Vital Energy, Inc. technincal analysis shows the sell today, and its 1 week rating is sell. Since market conditions are prone to changes, it's worth looking a bit further into the future — according to the 1 month rating Vital Energy, Inc. stock shows the sell signal. See more of Vital Energy, Inc. technicals for a more comprehensive analysis.
If you're still not sure, try looking for inspiration in our curated watchlists.
If you're still not sure, try looking for inspiration in our curated watchlists.