VTLE in Buy ZoneMy trading plan is very simple.
I buy or sell when:
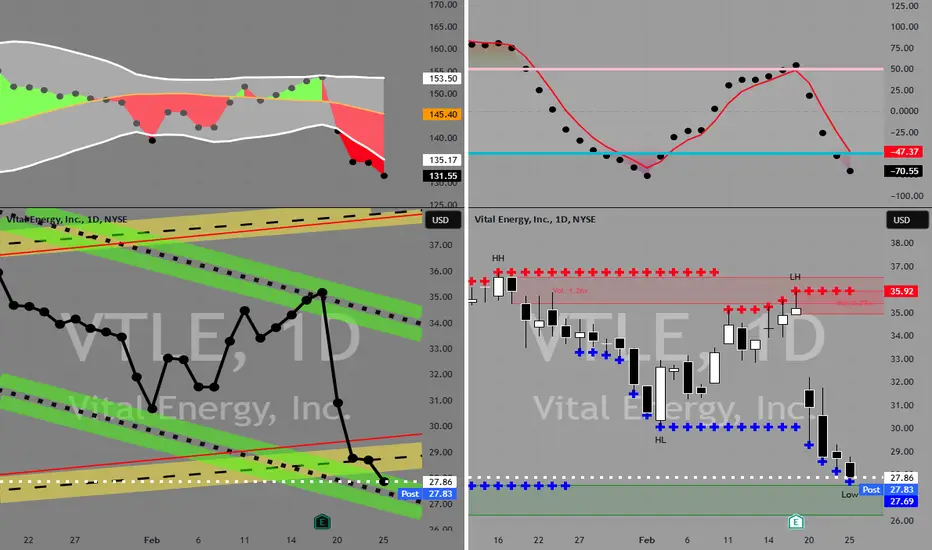
* Price tags the top or bottom of parallel channel zones
* Money flow spikes beyond it's Bollinger Bands
* Price at Fibonacci levels
So...
Here's why I'm picking this symbol to do the thing.
Price in buying zone at bottom channels
Stochastic Momentum Index (SMI) at oversold level
Money flow momentum is spiked negative and under at bottom of Bollinger Band
Target is upper channel zone around $34
VTLE trade ideas
VTLE/USD – 30-Min Long Trade Setup!📌 🚀
🔹 Asset: VTLE (Vital Energy, Inc.)
🔹 Timeframe: 30-Min Chart
🔹 Setup Type: Bullish Reversal Trade
📌 Trade Plan (Long Position)
✅ Entry Zone: Above $21.83 (Breakout Confirmation)
✅ Stop-Loss (SL): Below $20.59 (Invalidation Level)
🎯 Take Profit Targets:
📌 TP1: $23.80 (First Resistance Level)
📌 TP2: $25.93 (Extended Bullish Move)
📊 Risk-Reward Ratio Calculation
📉 Risk (SL Distance): $21.83 - $20.59 = $1.24 risk per share
📈 Reward to TP1: $23.80 - $21.83 = $1.97 (1:1.6 R/R)
📈 Reward to TP2: $25.93 - $21.83 = $4.10 (1:3.3 R/R)
🔍 Technical Analysis & Strategy
📌 Downtrend Breakout: Price has broken a falling trendline, signaling a bullish reversal.
📌 Support Rejection: The price bounced off $20.59 support, showing buyer strength.
📌 Volume Confirmation Needed: Ensure high buying volume when price holds above $21.83 to confirm bullish momentum.
📌 Momentum Shift Expected: If price remains above $21.83, it could push toward $23.80, and further to $25.93.
📊 Key Support & Resistance Levels
🟢 $20.59 – Stop-Loss / Support Level
🟡 $21.83 – Breakout Level / Long Entry
🔴 $23.80 – First Resistance / TP1
🔴 $25.93 – Final Target / TP2
📉 Trade Execution & Risk Management
📊 Volume Confirmation: Ensure high buying volume above $21.83 before entering.
📉 Trailing Stop Strategy: Move SL to entry ($21.83) after TP1 ($23.80) is hit.
💰 Partial Profit Booking Strategy:
✔ Take 50% profits at $23.80, let the rest run toward $25.93.
✔ Adjust Stop-Loss to Break-even ($21.83) after TP1 is reached.
⚠️ Fake Breakout Risk
❌ If the price fails to hold above $21.83 and drops back, exit early to avoid losses.
❌ Wait for a strong bullish candle close above $21.83 before entering aggressively.
🚀 Final Thoughts
✔ Bullish Setup – Bouncing from $20.59 support suggests a potential reversal.
✔ Momentum Shift Possible – Watch for volume confirmation.
✔ Favorable Risk-Reward Ratio – 1:1.6 to TP1, 1:3.3 to TP2.
💡 Stick to the plan, manage risk, and trade smart! 🚀📈
🔗 Hashtags for Reach & Engagement:
#StockMarket 📉 #VTLE 📊 #TradingNews 📰 #MarketUpdate 🔥 #Investing 💰 #Trading 📈 #Finance 💵 #ProfittoPath 🚀 #SwingTrading 🔄 #DayTrading ⚡ #StockTrader 💸 #TechnicalAnalysis 📉 #EconomicNews 🏛️ #FinancialFreedom 💡 #MarketTrends 📊 #StockAlerts 🔔 #TradeSmart 🤓 #Bullish 🐂 #RiskManagement ⚠️ #TradingCommunity 🤝

Go back to the shaded area for consistencyWith 41% insiders, 23% shorts, and institutions 60%, it has a rating of 50; I would be close to seeing a reversal candle and some good news for a retrieve.

VTLE | InformativeNYSE:VTLE
Analysis of Vital Energy Inc. (VTLE)
Current Status
Price: $44.32
Moving Averages: The stock is trading below its long-term moving averages, indicating a bearish trend.
Bullish Scenario
Bullish Trigger Line: $44.62
Confirmation: A break and close above $44.62 could signal a potential bullish reversal.
Target Prices for Bullish Scenario:
Target Price 1: $45.84
Target Price 2: $48.85
Bearish Scenario
Bearish Line: $42.58
Confirmation: A break and close below $42.58 would reinforce bearish sentiment.
Target Prices for Bearish Scenario:
Target Price 1: $40.60
Additional Observations
Volume: Recent volume spikes suggest strong market interest, potentially indicating a reversal or continuation of the trend.
RSI (Relative Strength Index): Currently around 45, showing potential for bullish momentum if it crosses above 50.

VTLE 3d Chart Q2 2024VTLE, has been accumulating after bottoming a few years ago and recently broke out of the down channel of the last 1.5 years.
If the recent moves in the oil and energy sector continue, this has room to run. If this continues, I would like to see it retest the 62-63 zone successfully and hold it convincingly.

VTLE: Potential BuyPotential inverse head and shoulders pattern forming. Also coming to retest the major support area.
