I got $W #W for $250 When MACD tell you to buy and other to sellDo I like the product? Yes!!!
Do I like the man behind the wheel? I have no idea.
Do I like the profit? Yess!!!
I got $W #W for $250 When MACD tells you to buy and others to sell.
Any ideas?
W trade ideas


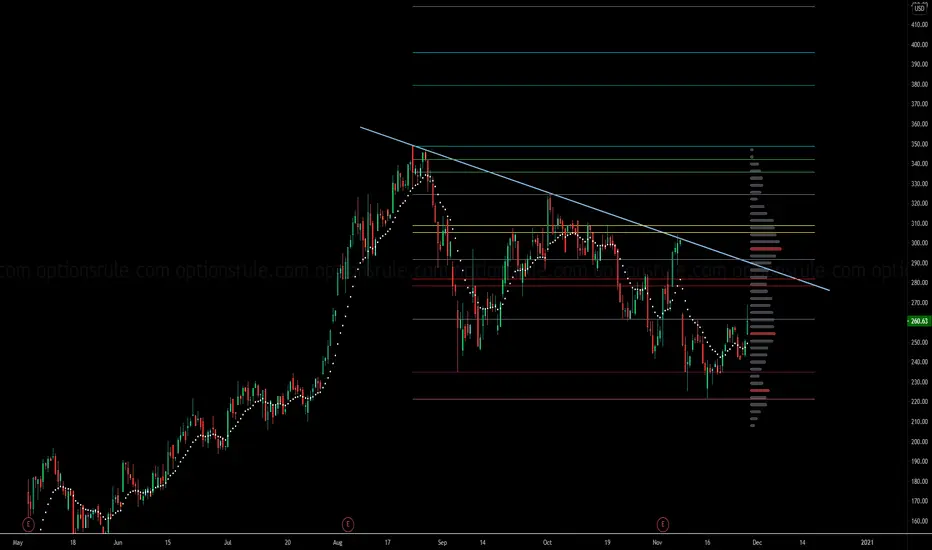
Broke Channel!!! This is insane world. I am not going to get it any longer after January settle down. I have 40 other positions to hold and don't wanna get worry into this. But if you are in this stock early, congratulations!!!
NO FOMO
Good Luck in 2021!

Wayfair Before Earnings Rally - Feb 25 RSI and MACD are indicating a pull back to support levels 221- 233. On watch.

$W - Stimulus: more furniture buying$W #tradeidea
+ bullish falling wedge
+ lockdown going hard
+ stimulus checks
- this name ran HARD last year. winners keep winning?

W Longsimilar looking chart to BBBY
e-commerce retailer breakout, blast off and rocket away we go
Not sure if i will play this as I have so many plays on my portoflio on the go already but considering grabbing maybe 1-2 calls that are 3 months out just to test my theory on whether my TA is right
tight stop loss just under the breakout incase my idea is wrong

W - Buy the breakout confirmationWhen it confirms breakout its a good spot to get in for a few days swing in options at a minimum until it starts to retest. On retest buy a leap if it confirms breakout

Wayfair wedge pattern breakout or breakdown ?As you can see since Sept it's been a battle.. Faked breakout a couple of times. Could go either way and that's I have my targets for long (Green line) or short (Redline)


Wayfair Bullish Falling WedgeIf price bounces off support line I will buy on the expectation it will easily hit target 1:$260... If it hits resistance here, sell and take profits however, if there is a strong breakout of resistance line we could see some really nice upside. I am watching closely over the next couple days and will consider buying call options if the right opportunity presents itself.

Wayfair Inc-Expecting a quick bounce off support line to Target1Should bounce off support and easily climb back to target 1... If price reaches target 1 but hits resistance wait and see if double bottom forms. breaks through target 1 it should easily climb up to target 2 price (which is resistance line). If it does climb to target 2 but fails to break resistance, sell and take profits. If it breaks resistance we can expect an upwards breakout.


$W (Wayfair) Sell before it's too late! The valuation is dumb here, I am shorting this stock long term at these levels... COVID stocks will sell off into Jan-Feb....

Wayfair (W): Buy at 324.31, Profit Taking at $405.39Stay at Home orders have affect us all and has made us rethink how we live in our own homes. Wayfair is an online retailer that helps us find the items we would liek to improve ours homes. They sell everyday decor items to appliances and they have growing earnings to prove they are growing. Sales and Earnings Below
Quarterly Sales:
Mar20: +20%
Jun20: +84%
Sep20: +67%
Quarterly EPS:
Mar20: Negative Earnings
Jun20: +313%
Sep20: +192%
Yearly EPS
2019: -8.03
2020: 4.43
2021: 2.21
The technical formation is shaping up nicely with a double bottom base. The yearly EPS is cause for concern is 2021 estimated EPS is lower than of 2020.
For more info on double bottom bases:
Thank you for reading the write up and be sure to tune in to Stocks Over Coffee for more insights!

Wayfair bullish falling wedge with upwards supportWayfair attempted to break out of the falling wedge this past week, it was walked back down by a -9.55% day. This dip decelerated today (12/24), and is expected to continue slowly until we hit support in the next week. It is the. Expected to test the top of the wedge again in 1-2 weeks, as the upwards support will continue upwards pressure.


Looking for breakoutNeutral waiting for move up. High on watch. Like this chart alot and would love entry on support or dotted trend

W AnalysisMACD and RSI curling up. Strong close and rejection of the trendline/support.
PTs: 260, 280


Potential Wayfair Trade In Either DirectionWayfair (W) is sitting right on a support line that was established on a daily chart . This price level was resistance in July, support in September, and held as support all last week. The level was breached once but it did close above. Wayfair has been in a down trend recently. The point where it bounced Tuesday was right at a Fib Retracement from this big run it has been on, so that is another level to keep in mind if it were to break below the horizontal support line.
What I like about charts like this is that we don't have to guess at what trade to take. Since we are sitting right on a sup/res line, if we open above this line, we can take a long position, with a stop slightly below. If we open below this level, we can take a short position with a stop slightly above. Since we are sitting right on a sup/res line, we will know right away if our trade idea is invalidated and we can exit with minimal losses. This one is on watch for Monday's open to see which direction it opens and what kind of strength or weakness it shows.


