AUD/NZD – Smart Money Rejection Setup🔍 **AUD/NZD – Smart Money Rejection Setup**
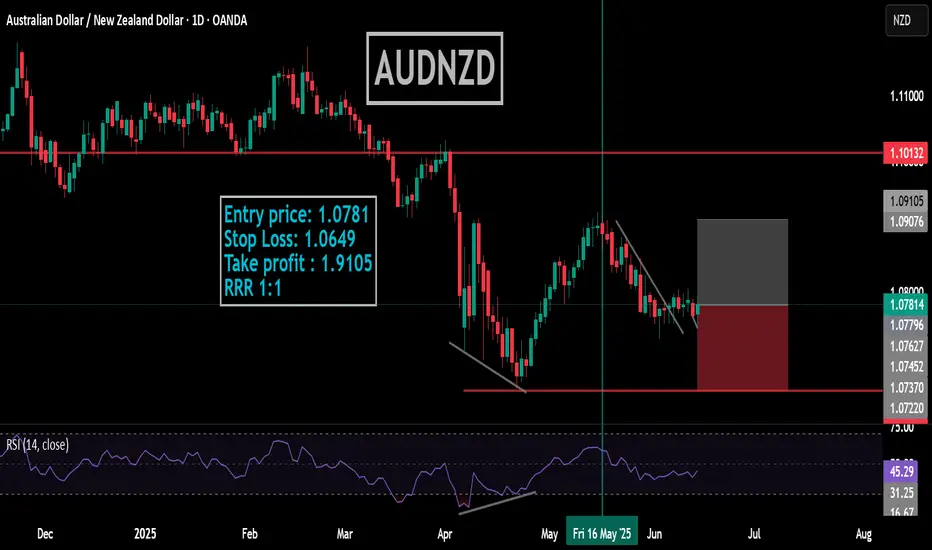
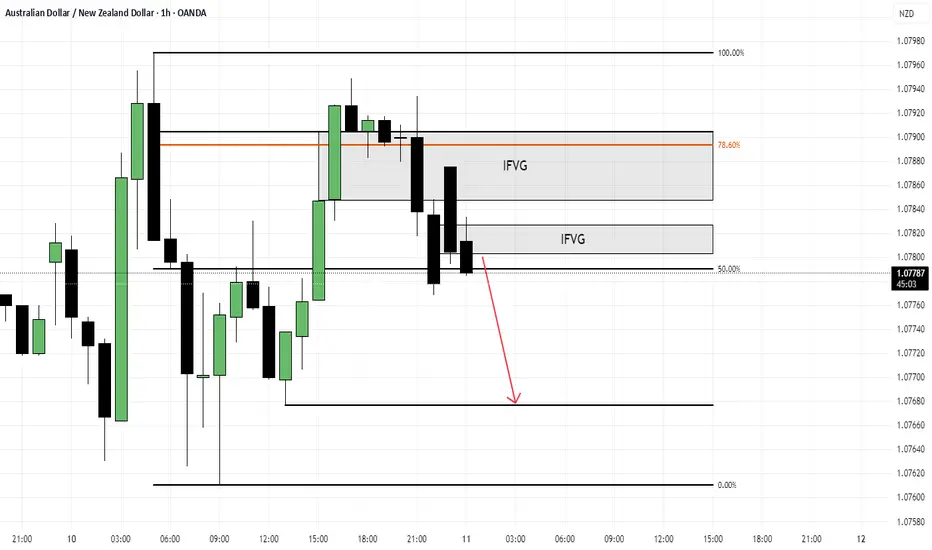
AUD/NZD is consolidating after forming a clear bearish structure on the daily and 1H timeframes. Price recently swept liquidity above the previous day’s high and rejected strongly from the premium zone.
On M15, we observed a CHoCH and BOS, with a bearish rejection candle confirming redistribution. RSI has flipped downward, reinforcing bearish intent.
🎯 Risk-Reward: 1:3+
🧠 With no major macroeconomic drivers this week, this setup favors pure technical structure based on Smart Money concepts. Execution should follow mitigation confirmation.
NZDAUD trade ideas

AUDNZD ANALYSIS AND TRADE AUDNZD though choppy, is still on its way to the downside
The trade can still be taken if market pulls back to entry.

AUDNZDChoppy and slow movement in the market last week on AUDNZD.
The trade can still be taken with a sell limit to the downside

! Audnzd Sell !audnzd is currently in a bearish trend on the Daily tf. its also trading inside of a Daily Supply zone. at the moment price is rejecting off a 30 and 15 poi levels. giving they are also in the Daily supply zone we have confluence added strength the Daily bearish bias. there are 4hr key levels underneath. im waiting to under for a close under the area where theres a 4hr and 15m key level close to each other.

AUDNZD Breakout Alert | Reversal in Play?The AUD/NZD pair is showing strong bullish momentum as price has finally broken above a long-standing bearish trendline. After a period of consolidation within a descending triangle, bulls have managed to push price above the resistance zone, signaling a potential trend reversal.
Key Observations:
🔹 Bearish Trendline Broken – Indicates a shift in momentum from sellers to buyers.
🔹 Resistance Level Target: 1.09216 – This level aligns with previous supply zones and is a key target for bulls.
🔹 Retest in Progress? – Watch for a possible retest of the breakout zone around 1.0780–1.0800. Confirmation here could offer a great long entry.
🔹 Bullish Projection – If the retest holds, price could rally aggressively toward the 1.09200 level in the coming sessions.
Trading Plan:
✅ Buy on retest confirmation of the broken trendline.
🛑 Stop-loss below the breakout zone (around 1.0760).
🎯 Target: 1.09216 (next major resistance).
💬 Let me know in the comments: Are you buying AUD/NZD or waiting for confirmation?
#AUDNZD #ForexTrading #Breakout #TrendReversal #TechnicalAnalysis #PriceAction #TradingView

AUDNZDAUDNZD is showing strong bearish momentum, with clear lower highs and lower lows forming on the 5-minute and 15-minute charts. Price has broken through key intraday support with increased volume, confirming strong seller presence. Momentum indicators support further downside, suggesting an ideal short scalp opportunity as the trend continues.
AUDNZD 09/06/2025Weekly:
-OB.
-Liquidity sweep.
-Weekly low acting as support.
Daily:
-Inverse H&S pattern.
-Bullish M pattern.
-IC.
4H:
-Bullish M pattern.

decisive moment for AUDNZD !! a broken trendline , after last LL price made support level and after that we can see a upward movement these confluences suggest that AUDNZD is going to start bullish rally currently the price is retracing and testing the drawn trendline. instant buy with SL just below the support zone or try to find bullish divergence on 30min or 15min tf and and then trade accordingly


AUDNZDCurrent 10-Year Bond Yields (June 1–10, 2025)
Australia: The 10-year government bond yield rose to approximately 4.34% on June 6, 2025, after a slight increase from earlier levels around 4.53% in late May 2025. The Reserve Bank of Australia (RBA) recently cut the cash rate to 3.85%, contributing to some volatility in yields.
New Zealand: The 10-year government bond yield was about 4.64% on June 6, 2025, slightly up from around 4.59% at the end of May 2025. New Zealand’s official cash rate stands at 3.50% as of April 2025.
Interest Rate Differential
The 10-year bond yield differential between New Zealand and Australia is roughly:
4.64%−4.34%=0.30%
This means New Zealand’s 10-year bonds yield about 30 basis points more than Australia’s.
The policy interest rate differential is about:
3.50%(NZ)−3.85%(AU)=−0.35%,
indicating Australia’s cash rate is currently higher by 35 basis points.
Uncovered Interest Rate Parity (UIP) Implications
UIP theory states that the expected change in the exchange rate between two currencies equals the interest rate differential between their countries E =iNZ−iAUE =i NZ−i AU
Using the policy rate differential (-0.35%), UIP would imply the NZD should depreciate against the AUD by about 0.35% over the relevant horizon.
Using the 10-year bond yield differential (+0.30%), UIP would imply the NZD should appreciate against the AUD by about 0.30%.
The conflicting signals reflect that short-term rates favor AUD while long-term yields slightly favor NZD. In practice, exchange rates are influenced by risk premiums, growth expectations, and monetary policy outlooks beyond pure UIP.
Key Upcoming June 2025 Economic Data (Australia and New Zealand)
Australia:
Inflation rate update (next CPI release)
Employment and unemployment data for May 2025
Retail sales and business confidence reports
RBA’s monetary policy statement and any forward guidance on rates
New Zealand:
Inflation expectations and Q2 CPI data
Unemployment rate and labor market reports
Trade balance and manufacturing PMI
RBNZ commentary on interest rates and inflation outlook
These economic releases will be critical for shaping market expectations on future interest rates and yield curves, thereby impacting the AUD/NZD exchange rate.
Summary
Metric Australia New Zealand Differential (NZ - AU)
10-Year Bond Yield ~4.34% (June 6, 2025) ~4.64% (June 6, 2025) +0.30%
Policy Interest Rate 3.85% (May 2025) 3.50% (April 2025) -0.35%
UIP Expected Exchange Rate — — Mixed signals (±0.3%)
Key June Data Inflation, employment, RBA policy Inflation, labor market, RBNZ guidance
The slightly higher long-term yields in New Zealand versus higher short-term rates in Australia create nuanced dynamics for AUD/NZD parity. The final exchange rate direction will depend on upcoming economic data releases and central bank communications in June 2025.
In conclusion, while New Zealand’s slightly higher 10-year bond yields create a positive interest rate differential over Australia, the strong economic ties and global influences mean that Australian bond yield changes materially affect New Zealand yields. This dynamic plays a significant role in shaping the AUD/NZD exchange rate through interest rate parity and market expectations
#AUDNZD #FOREX

AUD/NZD - Weekly Time frame Analysis📌 Technical Breakdown:
✅ Liquidity Sweep just occurred below previous lows, clearing weak long positions — a classic reversal signal.
🔂 Price tapped into a major weekly demand zone around the 1.04150 – 1.05000 range.
🔁 Strong reaction after hitting the 71% Fibonacci retracement, showing institutional buying.
🧱 Previous imbalance has been filled; structure now favoring a bullish continuation.
📈 The target: Buy-side liquidity above 1.10200 where price previously reversed with imbalance.
📊 Volume confirmed by a spike post-sweep — buyers are stepping in.
🎯 High-Probability Trade Setup:
Entry Zone: 1.0500 – 1.0600
Stop Loss: Below 1.0390 (beneath liquidity zone and fib invalidation)
Take Profit Target: 1.1000 – 1.1050
Risk-to-Reward: ~1:4+ depending on entry confirmation
🔮 Expectation:
Price may form a higher low retest around 1.0600 before launching.
A confirmed break above the imbalance at 1.0830 would unlock clean momentum toward buy-side targets.
🧠 Final Note:
This is a classic demand + liquidity + fib reversal setup on the weekly — ideal for a mid-to-long-term swing position with fundamental and technical alignment. Confirmation from daily/4H time frames can optimize your entry timing.


AUDNZD | XABCD PatternAUDNZD is clearly printing XABCD pattern which indicates bullish reversal from PRZ.We may take short trade after its breaking point B with SL at point C.After reversal we may againg ride a bullish trend after its breaking of first HH.

AUDNZD: Bulls Will Push
It is essential that we apply multitimeframe technical analysis and there is no better example of why that is the case than the current AUDNZD chart which, if analyzed properly, clearly points in the upward direction.
Disclosure: I am part of Trade Nation's Influencer program and receive a monthly fee for using their TradingView charts in my analysis.
❤️ Please, support our work with like & comment! ❤️

NNFX AUDNZD Short - Full Signal DelayedSignal: AUDNZD Short — Full Signal Delayed
Context: C1 signal, C2 2 days ago
Probability: Normal
Risk: 0.5% → C2 signal 2 days ago, all other indicators align. Volume is short.
R:R Plan: 1.3R, 75% scale-out at 1xATR TP for lower probability & drawdown management.
---
Notes:
Again, this is a trade I would not normally take, however, market gapped considerably below the close of the candle which my C1 triggered. The original candle where my C1 should have triggered if this was to be a full signal on time, was literally 1-2 pips away from triggering. Price had then pulled back on the next day, then gone short again on this day, triggering the C1.
Due to an order block sitting about 15 pips below price, I also would have used a pending order to enter the market which would not have been triggered until today.
Given this circumstance, and the gift of hindsight, this would have been a missed signal if I did not enter. I managed to enter at the same price I would have if the trade was completed 2 days ago but reduced risk to 0.5% to be cautious.

AUDNZD short movePrice is rising towards our supply zone, any bearish reaction can lead fall in price.

AUDNZD: Long Trade Explained
AUDNZD
- Classic bullish formation
- Our team expects growth
SUGGESTED TRADE:
Swing Trade
Buy AUDNZD
Entry Level - 1.0766
Sl - 1.0740
Tp - 1.0812
Our Risk - 1%
Start protection of your profits from lower levels
Disclosure: I am part of Trade Nation's Influencer program and receive a monthly fee for using their TradingView charts in my analysis.
❤️ Please, support our work with like & comment! ❤️

AUD/NZD SENDS CLEAR BULLISH SIGNALS|LONG
Hello, Friends!
AUD/NZD pair is trading in a local downtrend which we know by looking at the previous 1W candle which is red. On the 1D timeframe the pair is going down too. The pair is oversold because the price is close to the lower band of the BB indicator. So we are looking to buy the pair with the lower BB line acting as support. The next target is 1.089 area.
Disclosure: I am part of Trade Nation's Influencer program and receive a monthly fee for using their TradingView charts in my analysis.
✅LIKE AND COMMENT MY IDEAS✅

AUDNZD: Long Signal with Entry/SL/TP
AUDNZD
- Classic bullish formation
- Our team expects pullback
SUGGESTED TRADE:
Swing Trade
Long AUDNZD
Entry - 1.0769
Sl - 1.0744
Tp - 1.0819
Our Risk - 1%
Start protection of your profits from lower levels
Disclosure: I am part of Trade Nation's Influencer program and receive a monthly fee for using their TradingView charts in my analysis.
❤️ Please, support our work with like & comment! ❤️

AUD_NZD BEARISH BREAKOUT|SHORT|
✅AUD_NZD made a bearish
Breakout of the key horizontal
Level of 1.0783 and the breakout
Is confirmed so we are locally
Bearish biased and we will be
Expecting a further bearish
Move down
SHORT🔥
✅Like and subscribe to never miss a new idea!✅
Disclosure: I am part of Trade Nation's Influencer program and receive a monthly fee for using their TradingView charts in my analysis.
