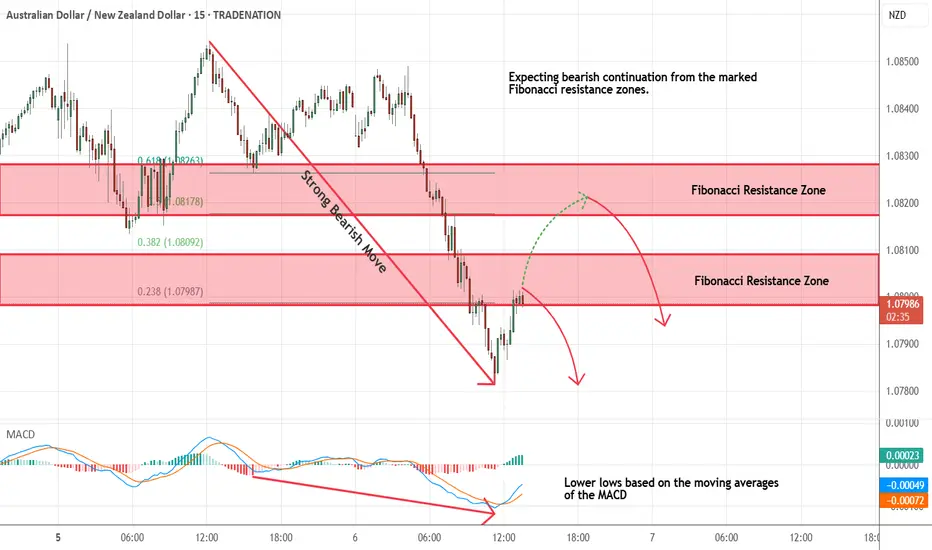
AUDNZD - Expecting Retraces Before Prior Continuation LowerM15 - Strong bearish momentum
Lower lows on the moving averages of the MACD indicator.
Expecting retraces and further continuation lower until the two Fibonacci resistance zones hold.
If you enjoy this idea, don’t forget to LIKE 👍, FOLLOW ✅, SHARE 🙌, and COMMENT ✍! Drop your thoughts and charts below to keep the discussion going. Your support helps keep this content free and reach more people! 🚀
--------------------------------------------------------------------------------------------------------------------
Disclosure: I am part of Trade Nation's Influencer program and receive a monthly fee for using their TradingView charts in my analysis.
NZDAUD trade ideas
AUDNZD Bullish Trade Breakdown — 9.99R Return Using Harmonics +
Hello traders!
If you enjoyed my previous post on the XAUUSD buy setup, then you're going to love this breakdown on AUDNZD—especially if you're interested in combining Harmonic Patterns with Smart Money Concepts (SMC) for precise trade entries. If you haven’t seen the Gold analysis yet, be sure to check it out below this post.
Let’s dive into this AUDNZD trade:
🔹 Weekly Analysis
On the weekly timeframe, price was reacting strongly to a key support level, which was confirmed by a long rejection wick:
🔹 Harmonic Pattern Setup
I anticipated a retracement toward the 0.786/0.886 Fibonacci levels of the previous bullish impulsive move, with the expectation of forming a Bullish Harmonic Pattern. And that’s exactly how it played out:
🔹 Pattern: Bullish Gartley
The setup was a classic Bullish Gartley, with the PRZ (Potential Reversal Zone) aligning perfectly with the 0.786 level. Price tested this area and confirmed the setup:
🔹 Entry Strategy: SMC x Harmonics
Entry Model: S2D (Supply-to-Demand) Flip Entry
Confirmation: After a CHOCH (Change of Character) on the M15 timeframe
H1 Sniper Entry: Not tagged, but our setup remained valid
Stop Loss: A tight 15 pips, limiting potential loss if the market didn’t respect the analysis
🔹 Trade Outcome
The entry was triggered successfully, and the trade hit:
✅ TP1
✅ TP2
✅ TP3 (at the 0.786 retracement level)
📊 Result: +9.99R
That’s nearly 10R return on a single trade—an excellent example of how combining Harmonic Patterns with SMC execution models can yield high-probability setups and strong returns.
💬 What About You?
Did you catch this move on AUDNZD, or perhaps take a different approach?
Let me know in the comments below—I’d love to hear how you approached it.
And don’t forget to stay tuned for more in-depth trade breakdowns like this, where I blend Harmonics + SMC to find precision entries.
Thanks for reading, and happy trading! 🚀

Short AUDNZDAUD is selling and nzd is buy at recent..
The market structure of AUDNZD as been on a down trend since last year .. by evaluating the pair and discounting the candlesticks we can tell it's below it's intrinsic value we an understandable margin of safety

AUDNZD (4H) Symmetrical Triangle Breakout+Falling Wedge ReversalOn the 4-hour chart of AUDNZD, the market has completed a compression phase inside a symmetrical triangle, nested within a larger falling wedge structure. Both patterns suggest a potential bullish reversal after an extended downward trend.
The breakout occurred to the upside, with price moving above the triangle and breaking through short-term resistance around 1.0713. Volume increased on the breakout, confirming genuine buyer interest. If the price holds above this level and breaks 1.0766, it opens the path to the next major target at 1.0844, aligned with the previous key swing level.
Technical picture:
– Symmetrical triangle breakout confirmed
– Price also broke out of the falling wedge
– Volume expansion on the move
– Bullish realignment of EMAs is starting
– Holding above 1.0713 + breaking 1.0766 will activate the next phase
Fundamental backdrop:
The Australian dollar is benefiting from resilience in the commodity and export sectors, while the New Zealand dollar faces pressure from weakening inflation and growing expectations of monetary easing by the RBNZ. This economic divergence creates short-term advantage for AUD over NZD.
This double-pattern setup confirms the transition from consolidation to bullish impulse. Holding above 1.0713 and a confirmed break above 1.0766 would unlock a move toward 1.0844. These patterns offer clean early entries into trend reversals.

AUD/NZD SHORT FROM RESISTANCE
Hello, Friends!
We are targeting the 1.081 level area with our short trade on AUD/NZD which is based on the fact that the pair is overbought on the BB band scale and is also approaching a resistance line above thus going us a good entry option.
Disclosure: I am part of Trade Nation's Influencer program and receive a monthly fee for using their TradingView charts in my analysis.
✅LIKE AND COMMENT MY IDEAS✅


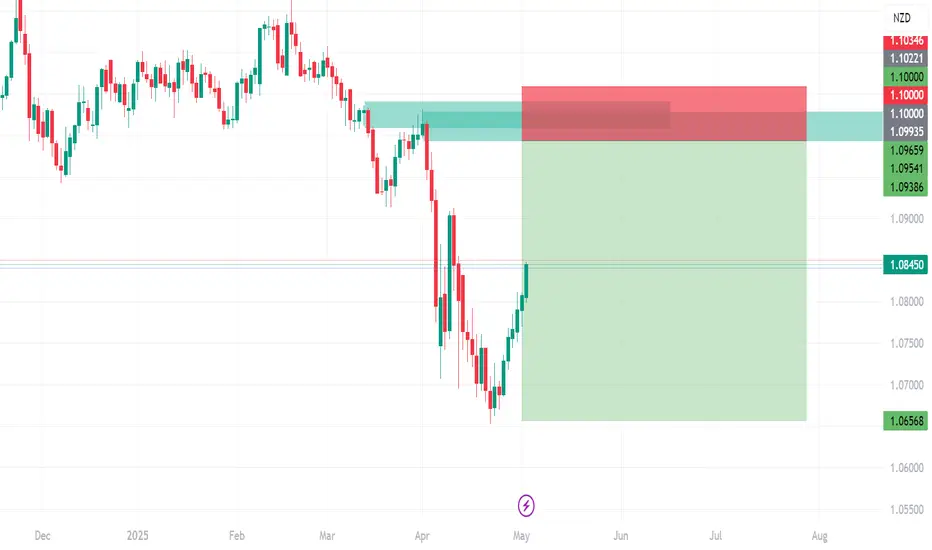
AUDNZD Daily Short from 1.1000 → 1.0657 (R:R ~9.9 : 1)Chart: Daily AUDNZD
Setup: Supply-zone rejection into established downtrend
🔍 Analysis
Trend Context:
― Since mid-February price has been making lower highs & lower lows, confirming a bearish bias.
Supply Zone:
― 1.0980–1.1035 area (highlighted) has flipped from support to resistance, printed clear bearish wicks on multiple daily closes.
Fibonacci Confluence:
― Entry at 1.1000 lines up with the 61.8% retracement of the March–April leg down.
Structural Support:
― Next major demand cluster sits at 1.0650–1.0680 (your TP zone), then psychological 1.0500.
📈 Trade Details
Entry (Sell): 1.10000
Stop-Loss: 1.10346 (just above the supply zone)
Take-Profit: 1.06568 (below April swing low)
Risk: 34.6 pips
Reward: 343.2 pips
R : R: ~9.9 : 1
🛠️ Execution & Management
Entry Trigger: Wait for a bearish daily close (engulfing or pin-bar) back inside 1.0980–1.1035.
Stop Adjustment: After +50 pips, move SL to breakeven to neutralize risk.
Scaling: Consider taking 50% off at 1.0850 (swing-to-swing) and letting the remainder run to 1.0657.
Catalyst Watch: Be mindful of RBA/NZ CPI events and AUD or NZD-related commodity data.
AUDNZD Elliott Wave AnalysisHello friends
On the AUDNZD currency pair chart, we are witnessing the formation of a complete Elliott wave pattern. These waves from 1 to 5 are quite clear and we can even count its sub-waves. Now a 5-wave pattern has formed, with wave C completed by a range.
Wave 5 of wave C is a contracting triangle.
Now the upper trend line of this triangle has been broken and pulled back.
So we expect the price to grow. Any situation may arise.
The first target is also the 1.08400 range.
The stop loss is also considered the 1.06500 range.
Good luck and be profitable.

AUDNZD-Sale OpportunityAUDNZD Sell Setup – Fibonacci Retracement Strategy
🕒 Timeframe:
4H or Daily (adjust based on your trading style)
📍 Key Levels:
Swing High: Recent high (e.g., 1.0940 area)
Swing Low: Recent low (e.g., 1.0700 area)
Use the Fibonacci retracement tool on TradingView:
Draw from the Swing High to the Swing Low.
Mark the key Fibonacci levels:
0.382 (~1.0795)
0.5 (~1.0820)
0.618 (~1.0845)
🔍 Entry Idea:
Sell Zone: Between 0.5 and 0.618 retracement (1.0820–1.0845)
Look for a bearish candlestick pattern or rejection wicks at these levels.
🎯 Targets:
TP1: Previous swing low (~1.0700)
TP2: Extension to 1.618 level (~1.0620)
🛑 Stop Loss:
Above the swing high or above 0.786 retracement level (~1.0880)
✅ Confluence:
Bearish trend or break in structure
RSI divergence or overbought on H4
Bearish price action at Fib level

Bullish rise?AUD/NZD has bounced off the pivot and could rise to the 1st resistance.
Pivot: 1.0755
1st Support: 1.07256
1st Resistance: 1.09043
Risk Warning:
Trading Forex and CFDs carries a high level of risk to your capital and you should only trade with money you can afford to lose. Trading Forex and CFDs may not be suitable for all investors, so please ensure that you fully understand the risks involved and seek independent advice if necessary.
Disclaimer:
The above opinions given constitute general market commentary, and do not constitute the opinion or advice of IC Markets or any form of personal or investment advice.
Any opinions, news, research, analyses, prices, other information, or links to third-party sites contained on this website are provided on an "as-is" basis, are intended only to be informative, is not an advice nor a recommendation, nor research, or a record of our trading prices, or an offer of, or solicitation for a transaction in any financial instrument and thus should not be treated as such. The information provided does not involve any specific investment objectives, financial situation and needs of any specific person who may receive it. Please be aware, that past performance is not a reliable indicator of future performance and/or results. Past Performance or Forward-looking scenarios based upon the reasonable beliefs of the third-party provider are not a guarantee of future performance. Actual results may differ materially from those anticipated in forward-looking or past performance statements. IC Markets makes no representation or warranty and assumes no liability as to the accuracy or completeness of the information provided, nor any loss arising from any investment based on a recommendation, forecast or any information supplied by any third-party.

AUDNZD BULLISH PROJECTIONMultiple TRENDLINE touches/rejections on the 12M timeframe which clearly indicates Bullish idea, a very strong Demand zone as well, and also we have Bullish Candlesticks patterns that also indicates a Bullish market. Going down to the 6M, 3M, and also the monthly timeframe, we have a Inverse Head and Shoulders Chart Patterns that occurred on each of the above aforementioned timeframes respectively. scaling down to the weekly timeframe, we have Candlestick Confirmation pattern that indicates a reversal to the upside.

AUDNZD Technical & Order Flow AnalysisOur analysis is based on multi-timeframe top-down analysis & fundamental analysis.
Based on our view, the price will rise to the monthly level.
DISCLAIMER: This analysis can change anytime without notice and is only for assisting traders in making independent investment decisions. Please note that this is a prediction, and I have no reason to act on it, and neither should you.
Please support our analysis with a boost or comment!
AUDNZD long time berish,- time for changes?
OANDA:AUDNZD we are have fall last 2 months, price is break DESCENDING CHANNEL, based on technicals here expectations are strong bullish.
SUP zone: 1.07300
RES zone: 1.09200, 1.09700

Watch This Wedge! AUDNZD Primed for Upside PushThe AUDNZD pair forms a falling wedge pattern, a bullish reversal formation that typically occurs after a downtrend. The price action is being squeezed between a descending resistance line and a descending support line, creating a narrowing range. The market is now attempting to break out of the wedge, with the current price testing the resistance line. A breakout and close above this trendline would signal bullish strength and could lead to a reversal of the recent downtrend.
Targets:
TP1: 1.07605
TP2: 1.07922
Stop Loss: Below the recent low at 1.06542

AUDNZD: Short Signal Explained
AUDNZD
- Classic bearish formation
- Our team expects pullback
SUGGESTED TRADE:
Swing Trade
Short AUDNZD
Entry - 1.0768
Sl - 1.0795
Tp - 1.0722
Our Risk - 1%
Start protection of your profits from lower levels
Disclosure: I am part of Trade Nation's Influencer program and receive a monthly fee for using their TradingView charts in my analysis.
❤️ Please, support our work with like & comment! ❤️

AUDNZD Will Go Higher From Support! Long!
Take a look at our analysis for AUDNZD.
Time Frame: 1D
Current Trend: Bullish
Sentiment: Oversold (based on 7-period RSI)
Forecast: Bullish
The market is testing a major horizontal structure 1.079.
Taking into consideration the structure & trend analysis, I believe that the market will reach 1.097 level soon.
P.S
The term oversold refers to a condition where an asset has traded lower in price and has the potential for a price bounce.
Overbought refers to market scenarios where the instrument is traded considerably higher than its fair value. Overvaluation is caused by market sentiments when there is positive news.
Disclosure: I am part of Trade Nation's Influencer program and receive a monthly fee for using their TradingView charts in my analysis.
Like and subscribe and comment my ideas if you enjoy them!

AUDNZD BUY TRADE PLAN🔥 AUDNZD TRADE PLAN 🔥
📅 Date: April 30, 2025
📋 TRADE PLAN OVERVIEW
Plan ID: ANZ30APR25-SW
Type: Swing
Direction: Buy
Confidence: ⭐⭐⭐⭐ (86%)
Risk:Reward: 4.3:1
Status: Waiting
🧭 Guidance Note:
Primary Swing Plan based on fresh bullish BOS + H4 reversal structure confirmed. D1 sweep + OB reclaim. No tactical sell exists. Risk = 1%.
📈 MARKET BIAS & TRADE TYPE
Bias: 📈 Bullish
Trade Type: Reversal → Continuation (Nested OB + BOS-Based Swing Entry)
🔰 CONFIDENCE LEVEL
Confidence: ⭐⭐⭐⭐ (86%)
Weight Breakdown:
• D1 Bullish BOS → 28%
• H4 Bullish OB Reclaim + iBOS → 22%
• H1 OB + Sweep Confirmed → 16%
• Macro Confluence (AUD Bullish, NZD Neutral) → 14%
• Volume Spike M30 + VSA Matching → 6%
📍 ENTRY ZONES
🟥 Primary Buy Zone: 1.0760 – 1.0740
→ H1 OB nested inside H4 OB
→ Sweep + Rejection Observed
→ 70.5% Fib OTE Alignment
🟧 Secondary Zone: 1.0730 – 1.0715
→ Deep mitigation FVG fill zone
→ SMTZ-style reactive layer
❗ STOP LOSS
SL: 1.0690
• Below H1 OB + liquidity sweep wick
• Adjusted with 1x H1 ATR (17 pips)
• No SL tightening needed unless during news
🎯 TAKE PROFITS
TP1: 1.0835 → Immediate swing reaction zone (internal H1 liquidity)
TP2: 1.0900 → Clean H4 external liquidity sweep
TP3: 1.0975 → D1 premium reversal zone
📏 RISK:REWARD
• TP1: 2.3:1
• TP2: 3.6:1
• TP3: 4.3:1
✅ Meets Swing Standard (Min 3.5:1)
🧠 MANAGEMENT STRATEGY
• Risk: 1.00% of capital
• SL to BE +10 pips after TP1
• Scale Out:
→ 50% at TP1
→ 30% at TP2
→ 20% trailed toward TP3
• Immediate exit if NZD strengthens macroscopically or DXY spikes
⚠️ CONFIRMATION CRITERIA (Optional Manual Entry Enhancers)
✅ Entry can be set as pending limit OR wait for:
• M30/H1 bullish engulfing inside OB
• Volume spike M30
• No early entry — wait for clean candle formation if manual
⏳ VALIDITY
Plan Type: Swing
Expiration: 72 hours
Auto-expire if price doesn’t enter zone or violates structure within 3 days
❌ INVALIDATION
• D1 CHoCH against long bias
• SL wick violation and internal structure break
• Macro shift (AUD → Bearish, NZD → Bullish), sentiment score falls < +6
🌐 FUNDAMENTAL & SENTIMENT SNAPSHOT
• AUD Macro: Mildly Bullish (RBA steady, commodities up)
• NZD Macro: Neutral (RBNZ data-dependent)
• Retail Sentiment: 71% short AUDNZD → Bullish Confirmation
• DXY: Weakening → Favors AUD
• Cross-Market: AUDUSD firm, NZDUSD weak
Sentiment Score: +7/10
📋 FINAL TRADE SUMMARY
We are executing a bullish swing continuation on AUDNZD.
Entry aligns with OB reclaim, volume confirmation, and macro sentiment.
Targets offer clean upside, risk is managed institutionally.
No tactical sell setup active.

Long trade
AUDNZD Buyside Trade – Full Journal
Date/Time: Monday, 28th April 2025, 6:00 PM (Tokyo Session PM)
Pair: AUDNZD
Session: Tokyo PM
Entry TF: (5min)
Structure (30min)
🔹 Entry: 1.07603
🔹 Take Profit: 1.08119 (+0.48%)
🔹 Stop Loss: 1.07487 (–0.11%)
🔹 Risk-Reward Ratio: 4.45
Trade Reasoning
Price showed a bullish internal shift in structure with consecutive higher lows into the Tokyo PM session.
30min TF

AUDNZD Rejected – CPI & RBA Dovish Bias Pressures AussieKey Resistance Zone: 1.0780 – 1.0800
The pair tested this area twice and failed to break above, forming a clear double-top pattern. This is a bearish signal suggesting buyers are exhausted.
Price Action:
A strong bearish rejection candle followed the second resistance test, aligning with historical resistance and structure. The pair is now showing signs of reversal.
Support Levels to Watch:
🥅 Target 1: 1.0707 – Previous consolidation zone
🥅 Target 2: 1.0677 – Key swing low
📉 Stop Loss: Above 1.0800
Pattern: Rising wedge structure breaking down, signaling downside continuation.
🔍 Fundamental Analysis
🇦🇺 Australia (AUD) – Weakness Potential
RBA’s Dovish Leaning:
RBA Assistant Governor Kent emphasized external FX market risks and cautious positioning on monetary tightening, which dampens rate hike expectations【source: RBA speech】.
Key Data Incoming:
April 30: Quarterly CPI data
Forecasts suggest core inflation might ease, reducing pressure on the RBA to act. If CPI undershoots, it could trigger AUD selling.
AUD also faces pressure from global growth fears and risk-off sentiment.
🇳🇿 New Zealand (NZD) – Relative Strength
While the RBNZ has already started easing, the NZD has shown resilience amid improving trade balance and stable economic performance.
NZ Business Confidence is also due, which could influence near-term NZD moves, but broader positioning supports the Kiwi.
🧠 Sentiment Overview
The risk-reward favors shorts here:
Clear technical rejection
Bearish macro backdrop for AUD
Relative NZD strength
CPI data will be the key catalyst, and positioning ahead of it looks justified given current chart structure.
📝 Conclusion:
AUDNZD looks primed for a downside correction after repeated rejections at a major resistance zone. With dovish RBA commentary and potential soft inflation data ahead, short setups are favored with targets at 1.0707 and 1.0677.

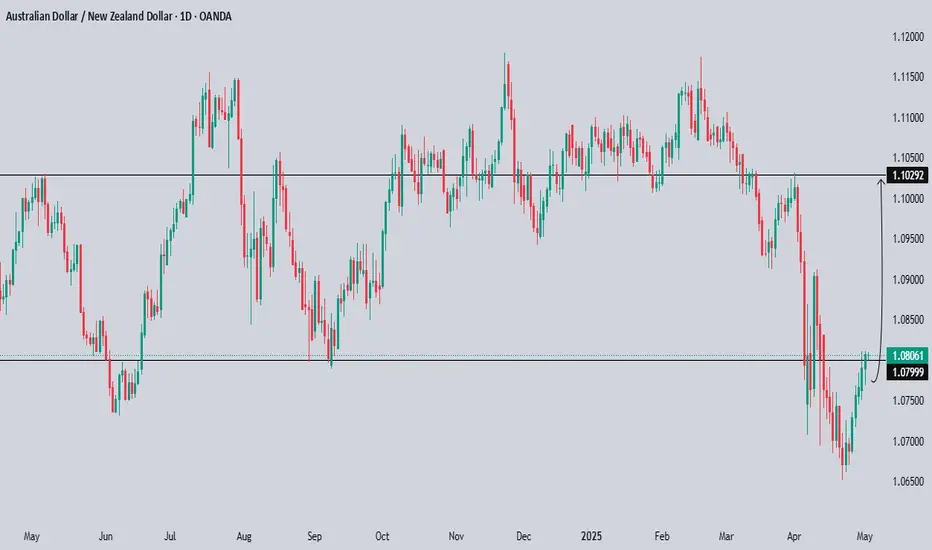
AUDNZD Hits Key Resistance at 1.0787 – A Bearish Move Ahead? AUDNZD Hits Key Resistance at 1.0787 – A Bearish Move Ahead?
AUDNZD recently tested a significant resistance zone at 1.0787, an area of historical importance.
The price has previously spent time around this level, reinforcing its relevance.
Given the ongoing bearish trend, AUDNZD could decline toward 1.0717 and 1.0680 in the coming days.
You may find more details in the chart!
Thank you and Good Luck!
❤️PS: Please support with a like or comment if you find this analysis useful for your trading day❤️
Disclosure: I am part of Trade Nation's Influencer program and receive a monthly fee for using their TradingView charts in my analysis.

The #1 Forex To BuyLearning how to trade these markets can be a challenge.
I was watching an execersing video on youtube
around early morning.
And this influencer said jump rope is one of the best cardio exercises.
And so when i dont feel like
exercising jump rope is what i revert or default to.
Think of the MACD indicator like a jump rope.
Notice that i have made a few alterations to the indicator?
I changed the MACD line into a histogram.
Also i used the parabolic SAR on 3 time frames.
-1 hour
-4 hour
-Daily
Going through this process is something you
have to see me demonstrating live.
As its not easy to explain the process over a text.
Open your simulation trading account and enter a buy order
if you want to see what happens next..
Rocket boost this content to learn more
Disclaimer:Trading is risky please learn risk management
and profit taking strategies.Also feel free
to use a simulation trading account.
Before you trade with real money.

AUDNZD - BEARISH MOVEHello Traders !
After a huge bearish move, The AUDNZD broke the support level (1.07312 - 1.07522).
This key level becomes new resistance!
So, I predict a bearish move📉
_______________
TARGET: 1.06100🎯
