NZD/CAD - Triangle Breakout (05.08.2025)The NZD/CAD Pair on the M30 timeframe presents a Potential Selling Opportunity due to a recent Formation of a Triangle Breakout Pattern. This suggests a shift in momentum towards the downside in the coming hours.
Possible Short Trade:
Entry: Consider Entering A Short Position around Trendline Of The Pattern.
Target Levels:
1st Support – 0.8096
2nd Support – 0.8087
🎁 Please hit the like button and
🎁 Leave a comment to support for My Post !
Your likes and comments are incredibly motivating and will encourage me to share more analysis with you.
Best Regards, KABHI_TA_TRADING
Thank you.
Disclosure: I am part of Trade Nation's Influencer program and receive a monthly fee for using their TradingView charts in my analysis.
NZDCAD trade ideas

Bearish Gameplan Activated – NZD/CAD Heist Operation💣 NZD/CAD “Kiwi vs Loonie” Forex Vault Robbery Heist Plan 🔫💰
Bearish Plan | Multiple Limit Orders | Scalping/Swing Style
🧠💼 Welcome to another high-stakes Thief Trader Heist – this time we're targeting the NZD/CAD vault. The Loonie's got weakness in its wings, and the Kiwi’s already flapping into the trap zone. Let's rob this pair clean!
📉 ENTRY – THE BREAK-IN
💼 "We ain't knocking... we entering ANY PRICE LEVEL!"
Layer your sell limit orders like traps in a museum – closest to recent highs on the 15m/30m/1H zones. Precision is profit. 🧨
🛑 STOP LOSS – EXIT ROUTE IF CAUGHT
🔐 0.81800 — placed at the swing high (4H chart level) for clean cutouts. Adjust based on your lot size & how many bags you carry 🧳📊
🎯 TARGET – VAULT LOCATION
🏁 0.80400 — that’s where we grab the loot and disappear like ghosts!
🎯 Day traders aim here.
🎯 Scalpers escape quicker with trailing SLs – grab and vanish!
⚙️ STRATEGY – THE THIEF’S TOOLKIT
🔹 Scalping? Only short!
🔹 Swinging? Ride the bearish tide 🌊
🔹 Use price traps, liquidity zones, fake breakouts – we exploit retail psychology 😈
🔹 Heist based on momentum, reversal patterns, exhaustion candles 🕵️♂️
📉 Sentiment shows retail stuck long 🪤
📈 Institutions flipping short 👀
📉 Trend = weak Kiwi, stronger Loonie boost from commodities
🚨 NEWS ALERT – STAY IN SHADOWS
Avoid high-impact news like CPI, BoC or RBNZ shocks. Thieves don’t rob during spotlight hours 🔦📉
🔥 Hit BOOST 💥 if you’re riding with the THIEF GANG 🔥
👑 Let’s make this plan viral, hit likes, share it, and rob the market clean 💰💸
Stay stealthy. Stay rich. Stay Thief. 🐱👤🕵️♂️💼

NZD-CAD Will Go UP! Buy!
Hello,Traders!
NZD-CAD made a retest
Of the horizontal support level
Of 0.8125 from where we
Are already seeing a nice
Bullish rebound so we will
Be expecting a further
Bullish move up
Buy!
Comment and subscribe to help us grow!
Check out other forecasts below too!
Disclosure: I am part of Trade Nation's Influencer program and receive a monthly fee for using their TradingView charts in my analysis.

NZDCAD SHORT Market structure bearish on HTFs DW
Entry at both weekly and daily
Weekly Rejection at AOi
Previous Weekly Structure Point
Daily Rejection at AOi
Daily EMA retest
Previous Structure point Daily
Around Psychological Level 0.82000
H4 Candlestick rejection
Levels 3.23
Entry 100%
REMEMBER : Trading is a Game Of Probability
: Manage Your Risk
: Be Patient
: Every Moment Is Unique
: Rinse, Wash, Repeat!
: Christ is King.

NZD_CAD REBOUND AHEAD|LONG|
✅NZD_CAD has been falling recently
And the pair seems locally oversold
So as the pair retested a horizontal support of 0.8125
And made a rebound
Price growth is to be expected
LONG🚀
✅Like and subscribe to never miss a new idea!✅


(art📊 Smart Money Concept Trade Setup (NZD/CAD – 30-Min Chart)
🧠 Market Structure Overview:
Price initially formed a Lower Low (left side of the chart).
Then, price made a clear Break of Structure (BOS) to the upside, creating a Higher High.
An IDM indicates price manipulation and confirms liquidity resting above the recent high (target).
🔍 Entry Plan:
📉 Price is currently dropping towards a marked 30-minute POI (Point of Interest) — a Demand Zone.
⏳ Once price enters this 30M POI zone, switch to the 5-minute or 1-minute timeframe for confirmation.
🔁 Look for a CHoCH (Change of Character) within the POI on the lower timeframe — this shows bullish intent and potential reversal.
📥 Enter a Buy trade right after CHoCH confirmation:
Stop Loss (SL): Just below the POI/Demand zone.
Take Profit (TP): At the Targeted High marked above (where external liquidity sits).
📐 Risk:Reward Details:
This setup offers a minimum 1:5 RR (Risk to Reward).
SL: Below the 30M POI.
TP: Just above the previous high (liquidity grab zone).
✅ Entry Checklist (English)
Entry Condition Status
Price entered 30M POI? ✅
CHoCH confirmed on 5M/1M? ✅
Bullish BOS or structure break visible? ✅
Risk:Reward at least 1:5? ✅

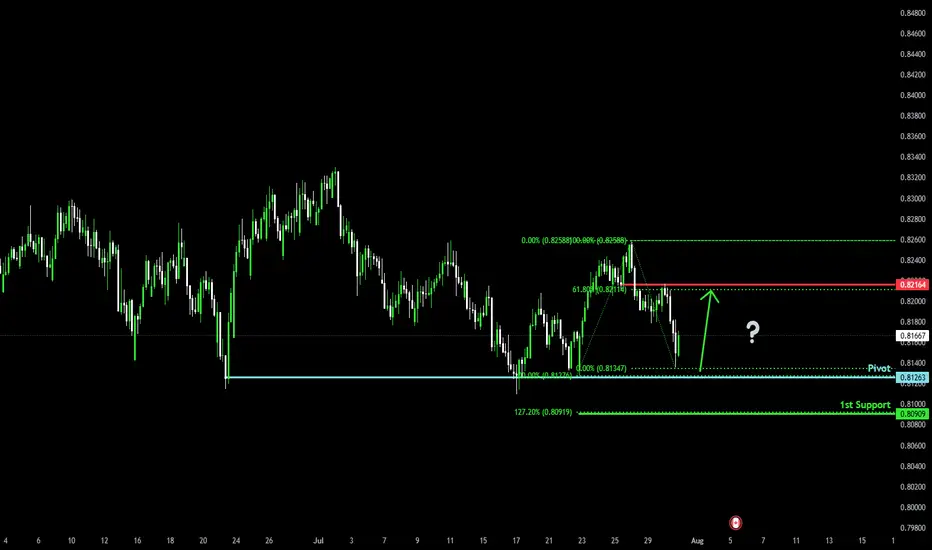
Bullish rise?NZD/CAD has bounced off the pivot and could rise to the 1st resistance.
Pivot: 0.81602
1st Support: 0.81199
1st Resistance:0.82167
Risk Warning:
Trading Forex and CFDs carries a high level of risk to your capital and you should only trade with money you can afford to lose. Trading Forex and CFDs may not be suitable for all investors, so please ensure that you fully understand the risks involved and seek independent advice if necessary.
Disclaimer:
The above opinions given constitute general market commentary, and do not constitute the opinion or advice of IC Markets or any form of personal or investment advice.
Any opinions, news, research, analyses, prices, other information, or links to third-party sites contained on this website are provided on an "as-is" basis, are intended only to be informative, is not an advice nor a recommendation, nor research, or a record of our trading prices, or an offer of, or solicitation for a transaction in any financial instrument and thus should not be treated as such. The information provided does not involve any specific investment objectives, financial situation and needs of any specific person who may receive it. Please be aware, that past performance is not a reliable indicator of future performance and/or results. Past Performance or Forward-looking scenarios based upon the reasonable beliefs of the third-party provider are not a guarantee of future performance. Actual results may differ materially from those anticipated in forward-looking or past performance statements. IC Markets makes no representation or warranty and assumes no liability as to the accuracy or completeness of the information provided, nor any loss arising from any investment based on a recommendation, forecast or any information supplied by any third-party.

NZD-CAD Bullish Flag Breakout! Buy!
Hello,Traders!
NZD-CAD made a bullish
Breakout from the bullish
Flag pattern and the breakout
Is confirmed so we are
Bullish biased and we will
Be expecting a further
Bullish move up
Buy!
Comment and subscribe to help us grow!
Check out other forecasts below too!
Disclosure: I am part of Trade Nation's Influencer program and receive a monthly fee for using their TradingView charts in my analysis.

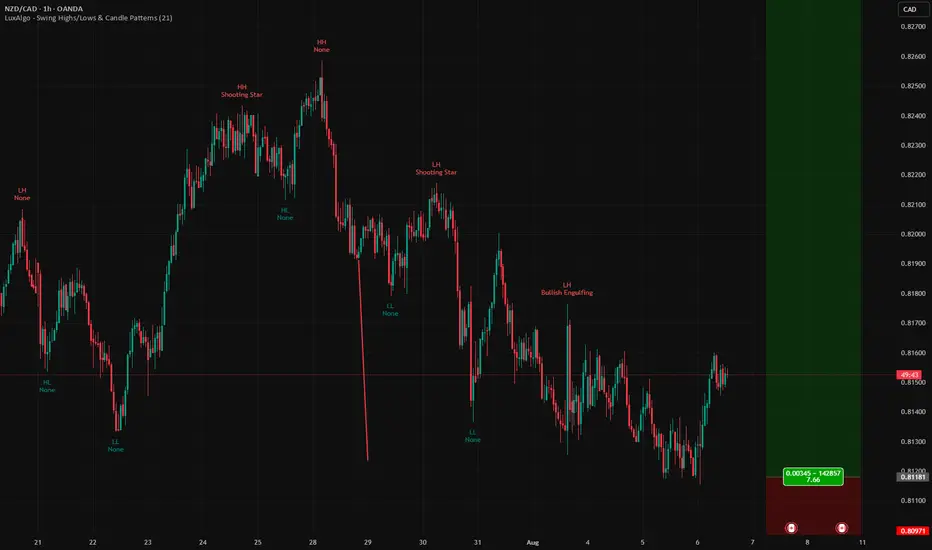
Bullish reversal?NZD/CAD is falling towards the pivot an could bounce to the 1st resistance.
Pivot: 0.81263
1st Support: 0.80909
1st Resistance: 0.82164
Risk Warning:
Trading Forex and CFDs carries a high level of risk to your capital and you should only trade with money you can afford to lose. Trading Forex and CFDs may not be suitable for all investors, so please ensure that you fully understand the risks involved and seek independent advice if necessary.
Disclaimer:
The above opinions given constitute general market commentary, and do not constitute the opinion or advice of IC Markets or any form of personal or investment advice.
Any opinions, news, research, analyses, prices, other information, or links to third-party sites contained on this website are provided on an "as-is" basis, are intended only to be informative, is not an advice nor a recommendation, nor research, or a record of our trading prices, or an offer of, or solicitation for a transaction in any financial instrument and thus should not be treated as such. The information provided does not involve any specific investment objectives, financial situation and needs of any specific person who may receive it. Please be aware, that past performance is not a reliable indicator of future performance and/or results. Past Performance or Forward-looking scenarios based upon the reasonable beliefs of the third-party provider are not a guarantee of future performance. Actual results may differ materially from those anticipated in forward-looking or past performance statements. IC Markets makes no representation or warranty and assumes no liability as to the accuracy or completeness of the information provided, nor any loss arising from any investment based on a recommendation, forecast or any information supplied by any third-party.
A Top Down Approach will help you spot quality tradesAll the information you need to find a high probability trade are in front of you on the charts so build your trading decisions on 'the facts' of the chart NOT what you think or what you want to happen or even what you heard will happen. If you have enough facts telling you to trade in a certain direction and therefore enough confluence to take a trade, then this is how you will gain consistency in you trading and build confidence. Check out my trade idea!!
www.tradingview.com

NZD/CAD BULLS ARE GAINING STRENGTH|LONG
NZD/CAD SIGNAL
Trade Direction: long
Entry Level: 0.820
Target Level: 0.824
Stop Loss: 0.817
RISK PROFILE
Risk level: medium
Suggested risk: 1%
Timeframe: 2h
Disclosure: I am part of Trade Nation's Influencer program and receive a monthly fee for using their TradingView charts in my analysis.
✅LIKE AND COMMENT MY IDEAS✅

NZDCAD: Bullish Continuation is Expected! Here is Why:
The analysis of the NZDCAD chart clearly shows us that the pair is finally about to go up due to the rising pressure from the buyers.
Disclosure: I am part of Trade Nation's Influencer program and receive a monthly fee for using their TradingView charts in my analysis.
❤️ Please, support our work with like & comment! ❤️

"NZD/CAD Reversal Play – Ride the Bullish Wave!🦹♂️💰 "THE KIWI-LOONIE HEIST: High-Voltage Forex Robbery Plan (NZD/CAD)" 💰🦹♂️
🌍 Attention all Market Pirates, Thieves & Profit Bandits! 🌍
🔥 Thief Trading Alert – NZD/CAD Bullish Heist Setup! 🔥
The "Kiwi vs Loonie" is setting up for a high-risk, high-reward robbery—and we’re locking in the master plan. Long entry is the play, but this ain’t for the weak hands. Overbought? Consolidation? Reversal trap? Perfect. That’s where we strike.
🎯 THE HEIST BLUEPRINT
🔑 ENTRY ZONE (Breakout & Retest Strategy)
"Wait for the 4H candle to CLOSE ABOVE 0.82600 (MA Breakout + Retest)."
Option 1: Place a BUY STOP above the MA (momentum confirmation).
Option 2: BUY LIMIT near recent swing lows (15M/30M precision).
🚨 Set an ALERT! Don’t miss the breakout—timing is everything.
🛑 STOP LOSS (Escape Route)
SL at 0.82000 (near swing low wick on 4H).
⚠️ Golden Rule: NO ORDERS BEFORE BREAKOUT! Wait for confirmation.
Adjust SL based on your risk, lot size, and multi-order strategy.
🎯 TARGETS (Profit Escape Plan)
Take Profit 1: 0.83300 (First resistance).
Or… Exit Early if the market turns shaky.
Scalpers: Long-only scalp plays! Use trailing SL to lock in gains.
⚡ THIEF TRADER PRO TIPS
✅ Fundamental Backing: Check COT reports, macro trends, intermarket signals.
✅ News Alert: Avoid new trades during high-impact news—protect open positions with trailing stops.
✅ Risk Management: Small lots, multiple entries = smarter heist.
💥 BOOST THE HEIST! (Let’s Get Rich Together) 💥
👉 Smash that 👍 LIKE button to fuel our next robbery plan!
👉 Follow for daily high-voltage setups.
👉 Comment "🚀" if you’re joining the heist!
🤑 NEXT HEIST COMING SOON… STAY TUNED, BANDITS! 🤑
🔥 WHY THIS TRADE? (Thief’s Edge)
Bullish momentum but trapped bears = perfect robbery setup.
Institutional levels + retail traps = our opportunity.
Not financial advice—just a well-planned theft. 😉
⚠️ Warning: Trading = Risk. Only play with funds you can afford to lose.

NZDCAD Will Go Lower! Short!
Take a look at our analysis for NZDCAD.
Time Frame: 1D
Current Trend: Bearish
Sentiment: Overbought (based on 7-period RSI)
Forecast: Bearish
The price is testing a key resistance 0.817.
Taking into consideration the current market trend & overbought RSI, chances will be high to see a bearish movement to the downside at least to 0.808 level.
P.S
Overbought describes a period of time where there has been a significant and consistent upward move in price over a period of time without much pullback.
Disclosure: I am part of Trade Nation's Influencer program and receive a monthly fee for using their TradingView charts in my analysis.
Like and subscribe and comment my ideas if you enjoy them!

NZDCAD - Bearish Price Action, Bearish confluencesNZDCAD has been shaping up to see a bearish move as we can see the price correctively retested a double top level which had corrective movement indicating sellers are present and we can see the next push downward.
Good Luck

NZDCAD Short opportunityOn the four hour time frame, we broke structure and price is suggesting a bullish run, we are over extended on the oscillators, and suspect we will come down to area where price pushed from on the break. Not as clean as the previous set ups but I still think we have a good probability we will return to this area even if we push up. I set the SL just above the next high that we would need to break to continue bullish run.
If we are wrong about bullish run, then price will go our direction all the same. I would take additional entries if we close above current entry and layer maybe 2-5 positions per candle close with SL's at previous highs. Use your best judgement.

NZDCAD higher bullish for expect
OANDA:NZDCAD price in PA, its make bounce on bottom line of PA, here after todays events expecting higher bullish continuation.
SUP zone: 0.81500
RES zone: 0.82600, 0.82850

NZD/CAD Potential Bullish Move in the makingHi Traders.
1. HTF BUllish Impulse
2. Correction Pattern
3. Falling Wedge Breakout
4. LTF Correction is forming . Wait for the current correction to finish to confirm this setup

NZD/CAD SENDS CLEAR BEARISH SIGNALS|SHORT
NZD/CAD SIGNAL
Trade Direction: short
Entry Level: 0.815
Target Level: 0.811
Stop Loss: 0.819
RISK PROFILE
Risk level: medium
Suggested risk: 1%
Timeframe: 4h
Disclosure: I am part of Trade Nation's Influencer program and receive a monthly fee for using their TradingView charts in my analysis.
✅LIKE AND COMMENT MY IDEAS✅

NZDCAD – Range Play with a Bullish Twist NZDCAD – Range Play with a Bullish Twist 🎯
Some trades aren't about chasing breakouts — they’re about precision timing. NZDCAD is stuck in a clear range, but the opportunity is at the bottom. Price is sitting right at demand, momentum is starting to turn up, and fundamentals give the bulls a reason to step in. This could be a quiet accumulation before the move.
📈 I’m bullish on NZDCAD — looking to buy at the bottom of the range.
Here’s why this setup has potential:
Strong demand zone holding price 📍
Range structure gives defined risk/reward 🎯
Bullish momentum building from oversold levels 🔄
CAD sentiment is soft amid trade concerns 📉
NZ fundamentals improving despite mixed sentiment ✅
New Zealand’s economy is slowly rebuilding momentum. Business confidence just hit an 11-year high, inflation is crawling back into target, and while the RBNZ has paused, the outlook isn’t overly dovish. Yes, further cuts are possible, but the currency has shown resilience — holding above 0.60 even in choppy conditions.
On the other side, CAD is vulnerable. Canada's GDP dipped in April and May, and while jobs data was solid in June, oil prices and trade tariffs continue to cloud the outlook. Speculators have ramped up short bets on the CAD, and that bearish tone might keep a lid on any strength — especially if US tariffs remain in play.
This is a classic buy-low setup. We’re at support, structure is intact, and both technical and macro factors are aligned.
Would you take this range buy — or wait for a breakout? Let’s compare notes.