NZDCAD Long – Breakout + Retest Opportunity Backed by Macros🔹 Pair: NZD/CAD
🔹 Timeframe: 1H
🔹 Direction: Long
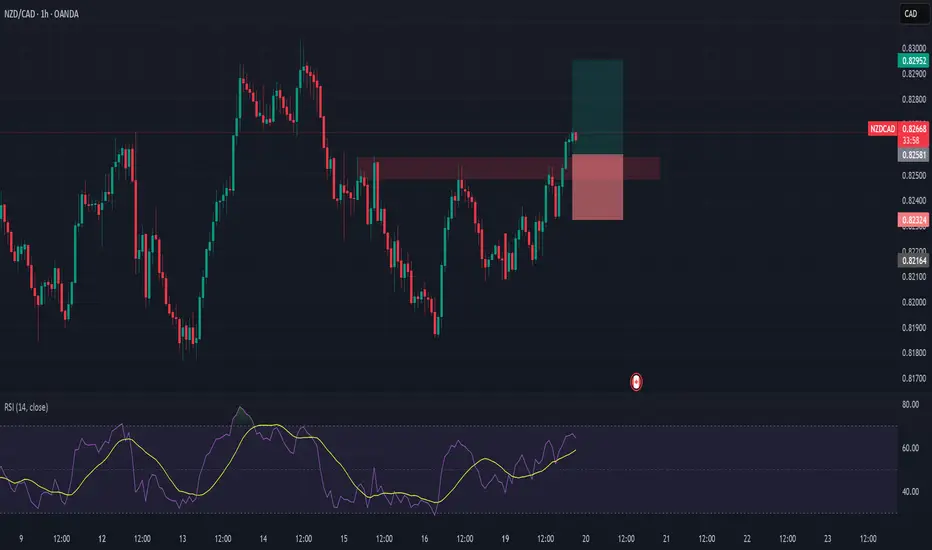
🔹 Status: Breakout of resistance → waiting for retest at turncoat support
🔹 Entry Zone (Planned): 0.8250–0.8260
NZD is the top gainer this week with strong conditional momentum and seasonal strength. CAD is stagnating under weak macro support. We're now watching for a pullback to the breakout zone for an ideal long entry.
Will look to enter between 0.8250–0.8260, SL under 0.8230, and aiming for 0.8295+.
📊 Macro & Fundamental Confluence
🇳🇿 NZD – Bullish
Biggest Weekly Gainer: Conditional score surged 🚀 from 8 → 13
Seasonal Bias: Strong buy signal from mid-May onward
Central Bank: RBNZ remains hawkish amid stable inflation targets
Risk-On Regime: VIX < 20 favors high-beta currencies like NZD
🇨🇦 CAD – Bearish
Policy vs Data Mismatch: BoC hawkish, but weak retail & CPI data
Global Headwinds: Commodity weakness and trade risks weigh on CAD
🧩 Confluences
✅ NZD macro & conditional strength
✅ CAD stagnation
✅ Risk-on favors NZD
✅ Technical breakout + higher high confirmed
NZDCAD trade ideas
NZD/CAD🔹Symbol: NZD/CAD
🔹Price: 0.82533
🔹Stop loss: 0.82736
🔹Take profit 1: 0.82248
🔹Take profit 2: 0.81850
📊Check your chart before entering.
♦️Check before use to make sure there is no important news.


NZDCAD bearish expectations after RBA
OANDA:NZDCAD price action visible, price currently in ascending channel, moving zig-zag last two weeks, here after yesterday RBA, having bearish expectations.
Break of violet doted line can be taked for confirm.
SUP zone: 0.82700
RES zone: 0.81500

NZDCAD - Bullish Flag PatternNZDCAD is forming Bullish Flag Pattern, will it move towards its target?
Entry, Stop Loss & Take Profit are mentioned.

NZD/CAD BUYERS WILL DOMINATE THE MARKET|LONG
Hello, Friends!
NZD-CAD downtrend evident from the last 1W red candle makes longs trades more risky, but the current set-up targeting 0.827 area still presents a good opportunity for us to buy the pair because the support line is nearby and the BB lower band is close which indicates the oversold state of the NZD/CAD pair.
Disclosure: I am part of Trade Nation's Influencer program and receive a monthly fee for using their TradingView charts in my analysis.
✅LIKE AND COMMENT MY IDEAS✅

NZDCAD The Target Is UP! BUY!
My dear followers,
This is my opinion on the NZDCAD next move:
The asset is approaching an important pivot point 0.8191
Bias - Bullish
Technical Indicators: Supper Trend generates a clear long signal while Pivot Point HL is currently determining the overall Bullish trend of the market.
Goal - 0.8219
About Used Indicators:
For more efficient signals, super-trend is used in combination with other indicators like Pivot Points.
Disclosure: I am part of Trade Nation's Influencer program and receive a monthly fee for using their TradingView charts in my analysis.
———————————
WISH YOU ALL LUCK

NZDCAD Is Bearish! Sell!
Take a look at our analysis for NZDCAD.
Time Frame: 10h
Current Trend: Bearish
Sentiment: Overbought (based on 7-period RSI)
Forecast: Bearish
The market is testing a major horizontal structure 0.824.
Taking into consideration the structure & trend analysis, I believe that the market will reach 0.817 level soon.
P.S
We determine oversold/overbought condition with RSI indicator.
When it drops below 30 - the market is considered to be oversold.
When it bounces above 70 - the market is considered to be overbought.
Disclosure: I am part of Trade Nation's Influencer program and receive a monthly fee for using their TradingView charts in my analysis.
Like and subscribe and comment my ideas if you enjoy them!

NZDCAD Selling Trading IdeaHello Traders
In This Chart nzdcad HOURLY Forex Forecast By FOREX PLANET
today NZDCAD analysis 👆
🟢This Chart includes_ (NZDCAD market update)
🟢What is The Next Opportunity on NZDCAD Market
🟢how to Enter to the Valid Entry With Assurance Profit
This CHART is For Trader's that Want to Improve Their Technical Analysis Skills and Their Trading By Understanding How To Analyze The Market Using Multiple Timeframes and Understanding The Bigger Picture on the Charts

NZD/CAD SHORT FROM RESISTANCE
Hello, Friends!
We are going short on the NZD/CAD with the target of 0.818 level, because the pair is overbought and will soon hit the resistance line above. We deduced the overbought condition from the price being near to the upper BB band. However, we should use low risk here because the 1W TF is green and gives us a counter-signal.
Disclosure: I am part of Trade Nation's Influencer program and receive a monthly fee for using their TradingView charts in my analysis.
✅LIKE AND COMMENT MY IDEAS✅

NZDCAD sell setup H1Hello! Friends,
Greetings. Please leave a Like if you like the idea.
Before start talking about technical Let's share your LOVE by giving me LIKES to support this work. Thanks in advance.

Price action Price has left liquidity above and swiped it currently looking for liquidity to push above

NZDCAD: Short-Term Bearish OutlookNZDCAD: Short-Term Bearish Outlook
Today, Canada will release its employment data. Analysts expect job numbers to rise by 2.5k, compared to last month’s sharp decline of -32.6k. The unemployment rate is also expected to edge up slightly to 6.8% from 6.7%.
If the job report shows improvement, it could strengthen the bearish momentum for NZDCAD.
From a technical perspective, NZDCAD has broken out of a triangle pattern, signaling increased downside pressure. The employment data could act as a catalyst for further movement.
Key levels to watch:
0.8160 – A strong zone where price might find support
0.8130 – The next target if the bearish trend continues
You may find more details in the chart!
Thank you and Good Luck!
❤️PS: Please support with a like or comment if you find this analysis useful for your trading day❤️
Disclosure: I am part of Trade Nation's Influencer program and receive a monthly fee for using their TradingView charts in my analysis.

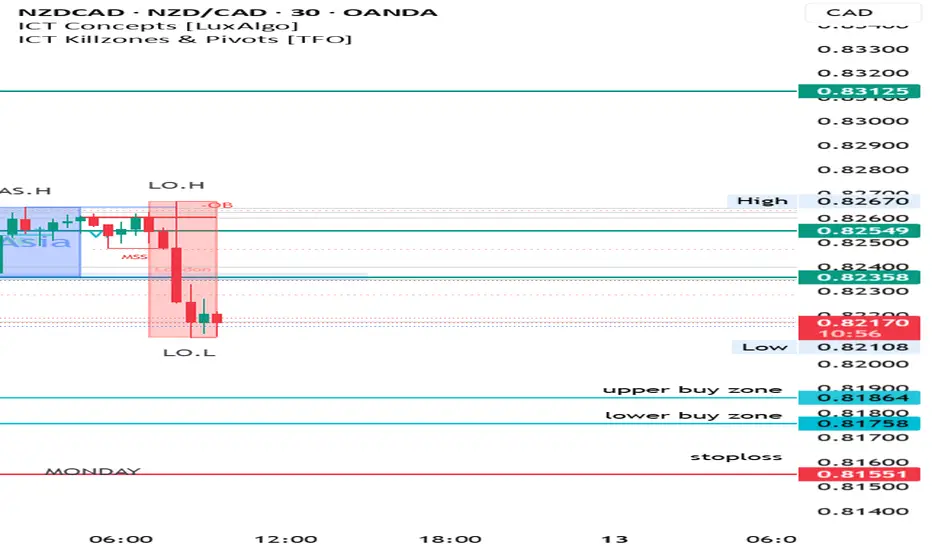
NZD CAD buy zone📊 Trade Breakdown: NZD/CAD Buy Setup 📊
📍 Buy Limit Orders placed at:
🔹 Top of the buy zone
🔹 Mid-zone
🔹 Bottom edge near previous ASL (Asian Session Low)
🎯 Target: Looking for a clean pullback into the London High — watching for that reaction zone to deliver.
🔍 Setup based on classic Supply & Demand + Order Block structure — no noise, just precision trading.
⚖️ Risk Management on point:
Split entries across levels
Defined TP & tight SL
Strong Risk-to-Reward potential
Now it’s all about discipline and execution — let price come to us. 🧘♂️
This is how real traders operate. Stay sharp. 🎯
💬 Got questions? Drop them below. Let’s level up together.
#NZDCAD #ForexSetup #SmartMoneyConcepts #OrderBlocks #SupplyDemand #TradingCommunity #FundedTrader #RiskReward #LearnAndEarn
NZDCAD BUYNZDCAD will go up judging from this inverted head and shoulders pattern. I am eyeing 0,82666 as a final target.

NZDCAD Technical & Order Flow AnalysisOur analysis is based on multi-timeframe top-down analysis & fundamental analysis.
Based on our view the price will fall to the monthly level.
DISCLAIMER: This analysis can change anytime without notice and is only for assisting traders in making independent investment decisions. Please note that this is a prediction, and I have no reason to act on it, and neither should you.
Please support our analysis with a boost or comment!

NZD_CAD LONG SIGNAL|
✅NZD_CAD is going down to
Retest a horizontal support of 0.8160
Which makes me locally bullish biased
And I think that we will see a rebound
And a move up from the level
So we can go long wit the
TP of 0.8206 and the SL of 0.8152
LONG🚀
✅Like and subscribe to never miss a new idea!✅
Disclosure: I am part of Trade Nation's Influencer program and receive a monthly fee for using their TradingView charts in my analysis.

NZD/CAD at Key Support: Reversal Opportunity or Bearish Breakdow✅ Detailed Technical Conclusion (Based on H4 Chart & Indicators)
The NZD/CAD pair is currently trading near the bottom of a well-defined range between 0.81800 and 0.83000, representing a major horizontal support level that has been respected multiple times over recent weeks.
Despite the broad bearish sentiment reflected in the moving averages (all indicating Sell) and momentum indicators like MACD and Momentum (10), several important reversal signals are starting to emerge:
🔍 Bullish Reversal Clues
Commodity Channel Index (CCI) is at -174, a deeply oversold reading, often preceding a bullish bounce.
Stochastic %K is at 16.1, and RSI at 36.1 — both nearing or in oversold territory.
Price is sitting on S1 Pivot (0.81611) and close to the range floor, where previous rebounds occurred.
Heatmap Fundamentals show NZD strengthening while CAD remains relatively weak, supporting bullish outlook.
⚠️ Bearish Pressure Risks
All major moving averages (from EMA10 to SMA200) are above price and aligned in a bearish stack.
Break and close below 0.81600 would invalidate the range and expose the next targets near 0.81000 and 0.80000.
Momentum is still weak, so confirmation of a bounce is essential before entering a long.
📌 Strategic Conclusion
If the 0.81800 support holds with bullish price action confirmation, this presents a high-reward long opportunity, aiming for a breakout above 0.83000 and extension toward 0.84000 or higher.
If 0.81600 fails decisively, traders should shift to a bearish outlook, targeting the 0.81000 and 0.80000 zones.


NZD/CAD For Bullishwait for pull-back near by entry point and then go long
general trend is up trend
have fun :)

NZDCAD buy setup H1Hello! Friends,
Greetings. Please leave a Like if you like the idea.
Before start talking about technical Let's share your LOVE by giving me LIKES to support this work. Thanks in advance.

NZD/CAD For Bullishyou can go long now
or
wait for pull-back near by entry point and then go long
general trend is up trend
have fun :)

NZDCAD buy setup Following Price Order flow and structural pattern, we can deduce that price is in a demand.
