NZDCADbuying nzdcad
sl 0.82140
tp 0.83207
1% risk on each trade
like an follow
follow me for more
long on NZD/CAD
NZDCAD trade ideas

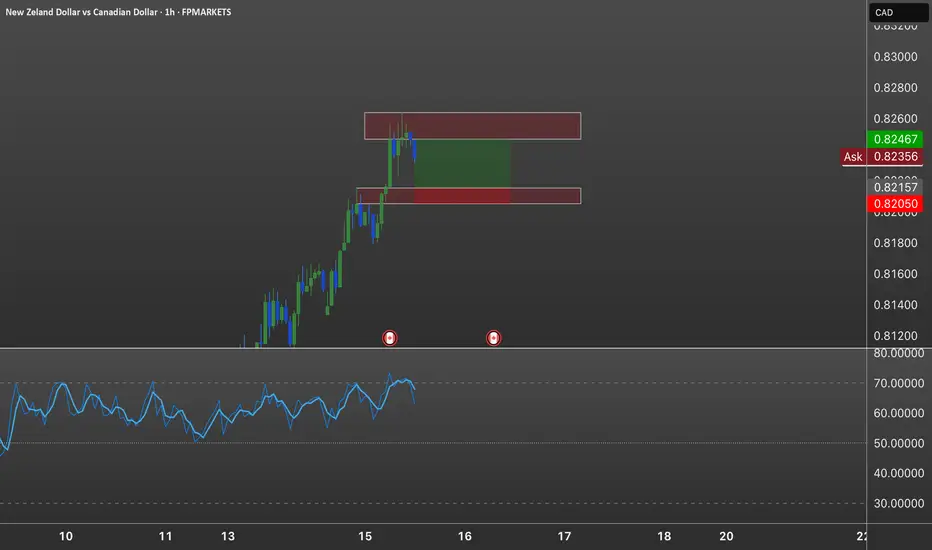
NZDCAD Buy Limit Setup
Timeframe: 15 minutes
Direction: Long (Buy)
Entry Type: Limit Order
Risk-to-Reward Ratio: 2.9
Technical Context:
The trade is based on a clean bullish structure following a strong upward impulse. The pair broke above a significant resistance zone, which has now been re-tested as potential support. This zone aligns with a prior consolidation area and serves as a key decision level.
Entry Level:
A Buy Limit order is placed at 0.82162, anticipating a retracement into the broken resistance-turned-support zone.
Stop Loss:
Placed just below the lower boundary of the structure at 0.82037, accounting for potential volatility while maintaining structural invalidation.
Take Profit:
Targeting 0.82463, aligning with the upper boundary of the previous range and offering a favorable risk-to-reward profile of 2.9.
Trade Rationale:
This setup is designed to capitalize on a pullback within a strong intraday uptrend, taking advantage of market structure shifts. By waiting for price to return to a high-probability zone, the entry maximizes precision and minimizes drawdown.
Notes:
This trade was considered only after a successful earlier setup, reinforcing the psychological discipline of not overtrading. The entry is conditional—if price does not return to the desired level, the trade will be skipped, maintaining the quality-first approach.
NZDCAD SHORT Market structure bearish on HTFs DW
Entry at Daily and Weekly AOi
Weekly Rejection at AOi
Daily Rejection at AOi
Daily EMA retest
Previous Structure point Daily
Around Psychological Level 0.81500
H4 Candlestick rejection
Levels 6.67
Entry 90%
REMEMBER : Trading is a Game Of Probability
: Manage Your Risk
: Be Patient
: Every Moment Is Unique
: Rinse, Wash, Repeat!
: Christ is King.

NZDCAD - Change of character Hello Traders !
The NZDCAD failed to create a new lower low !
The Lower high is broken (change of character).
So, I predict a bullish move🚀
________________
TARGET: 0.81780🎯

Cadnzd We hv price on our zone we are expecting a rejection from de zone on 1 day and a change of structure on 4hrs den we buy

NZD/CAD For Bullish as Pull-Backwait for pull-back near y entry point and then go long
general trend is down trend
current phase is pull-back
have fun :)

NZDCAD BUY OPPORTUNITY Price found support at 0.78362 and rebounded. A buy opportunity is envisaged from from the current market price. Expected profit level is 0.81933 and 0.83351

CadnzdCadnzd on de 1 week and 1 day is on a uptrend so we are expecting a retracment to de zone den a reversal candle stick den we buy

NZDCAD – Short-Term Bullish Setup (1H Divergence)✅ Key Observations:
Timeframe: 1 Hour
Signal: Bullish Divergence
Bias: Short-term bullish, possibly within a larger corrective structure
🔍 Technical Confluences:
Bullish Divergence on RSI or MACD:
Price made a lower low, while oscillator made a higher low – signaling weakening bearish momentum.
Possible Support Area:
Near a recent demand zone
May coincide with a minor trendline or Fibonacci level
Candle Structure:
Look for a bullish engulfing or pin bar to confirm reversal
📈 Trade Plan – LONG Position
Entry:
Buy after confirmation candle forms (bullish candle closing above previous one)
Or after a minor resistance break (micro-structure shift)
Stop Loss:
Just below the swing low where divergence formed
Take-Profit (Short-Term):
TP1: Nearest resistance level / recent high
TP2 (optional): Fib 0.618 retracement of the previous bearish move
Risk-to-Reward: Target at least 1:1.5 or 1:2
⚠️ Watch For:
A pullback before the full move starts – don't chase the first green candle blindly
If price makes a lower low with no divergence, re-evaluate the setup

NZD/CAD For Bullishwait for pull-back near entry point and then go long
general trend is Down Trend
current phase is pull-back
have fun :)

NZDCAD - Bullish ReversalNZDCAD has formed a doublw bottom and breaking its neckline. Entry above last high with SL below double bottom.

NZDCAD: Bullish Move From Support 🇳🇿🇨🇦
There is a high chance that NZDCAD will go up from the underlined support.
As a confirmation, I spotted a cup and handle pattern on an hourly chart.
Goal - 0.792
❤️Please, support my work with like, thank you!❤️
I am part of Trade Nation's Influencer program and receive a monthly fee for using their TradingView charts in my analysis.

NZDCAD What Next? SELL!
My dear subscribers,
This is my opinion on the NZDCAD next move:
The instrument tests an important psychological level 0.7949
Bias - Bearish
Technical Indicators: Supper Trend gives a precise Bearish signal, while Pivot Point HL predicts price changes and potential reversals in the market.
Target - 0.7903
About Used Indicators:
On the subsequent day, trading above the pivot point is thought to indicate ongoing bullish sentiment, while trading below the pivot point indicates bearish sentiment.
Disclosure: I am part of Trade Nation's Influencer program and receive a monthly fee for using their TradingView charts in my analysis.
———————————
WISH YOU ALL LUCK

NZD/CAD For Bullishyou can go long now
or
wait for pull-back near by entry point and then go long
current phase is pull-back and may be finish near by target 3
have fun :)

NZDCAD Trade Setup - 06/Apr/2025Hi Traders,
I expect this pair to start to go up very soon.
The trade RR depends on your trading style and management.
The expected highlighted move is based on For3xScalper findings regarding its special zones combined with WTW special wave concept.

NZDJPY 4HNZDJPY 4h
Based on MMSM, IRL to ERL , weekly CRT and Order flow is bearish.
it's only my view though. Always check your analysis before taking trade. Thank you and happy trading .


Bullish bounce?NZD/CAD has bounced off the pivot and could rise to the 1st resistance.
Pivot: 0.81458
1st Support: 0.81095
1st Resistance: 0.82317
Risk Warning:
Trading Forex and CFDs carries a high level of risk to your capital and you should only trade with money you can afford to lose. Trading Forex and CFDs may not be suitable for all investors, so please ensure that you fully understand the risks involved and seek independent advice if necessary.
Disclaimer:
The above opinions given constitute general market commentary, and do not constitute the opinion or advice of IC Markets or any form of personal or investment advice.
Any opinions, news, research, analyses, prices, other information, or links to third-party sites contained on this website are provided on an "as-is" basis, are intended only to be informative, is not an advice nor a recommendation, nor research, or a record of our trading prices, or an offer of, or solicitation for a transaction in any financial instrument and thus should not be treated as such. The information provided does not involve any specific investment objectives, financial situation and needs of any specific person who may receive it. Please be aware, that past performance is not a reliable indicator of future performance and/or results. Past Performance or Forward-looking scenarios based upon the reasonable beliefs of the third-party provider are not a guarantee of future performance. Actual results may differ materially from those anticipated in forward-looking or past performance statements. IC Markets makes no representation or warranty and assumes no liability as to the accuracy or completeness of the information provided, nor any loss arising from any investment based on a recommendation, forecast or any information supplied by any third-party.

NZDCAD ; BULLISH REVERSAL CONFIRMEDNZDCAD; may continue to sell this is after it breaks through the trendline
There a strong support zone around 1.81200
The price may pull back to the previous highs
Daily/H1/M15 , They all show buy confirmation

NZDCAD SELL/SHORTBy utilizing Fibonacci retracement levels, historical patterns, , we can formulate a hypothesis that the market might follow a similar trajectory if bearish sentiment prevails.

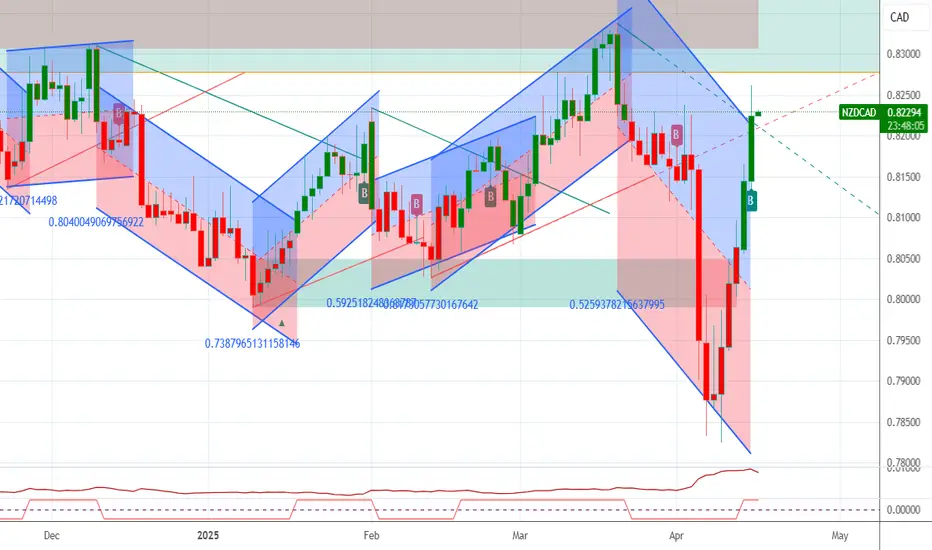
NZDCAD💡Chart analysis of the NZD/CAD currency pair (4-hour timeframe). A falling wedge pattern appears, a reversal pattern that indicates a potential price rally after a breakout. The MACD indicator supports the bullish scenario, showing improved buying momentum after the breakout.
⛔️Not investment advice. For educational purposes only.

NZDCADWhile NZDCAD has recently faced downward pressure after hitting resistance, indicates a possible rebound towards higher levels.
