Bullish bounce?NZD/CAD has bounced off the pivot which acts as a pullback support and could rise to the 1st resistance which is a pullback resistance.
Pivot: 0.81458
1st Support: 0.81069
1st Resistance: 0.82317
Risk Warning:
Trading Forex and CFDs carries a high level of risk to your capital and you should only trade with money you can afford to lose. Trading Forex and CFDs may not be suitable for all investors, so please ensure that you fully understand the risks involved and seek independent advice if necessary.
Disclaimer:
The above opinions given constitute general market commentary, and do not constitute the opinion or advice of IC Markets or any form of personal or investment advice.
Any opinions, news, research, analyses, prices, other information, or links to third-party sites contained on this website are provided on an "as-is" basis, are intended only to be informative, is not an advice nor a recommendation, nor research, or a record of our trading prices, or an offer of, or solicitation for a transaction in any financial instrument and thus should not be treated as such. The information provided does not involve any specific investment objectives, financial situation and needs of any specific person who may receive it. Please be aware, that past performance is not a reliable indicator of future performance and/or results. Past Performance or Forward-looking scenarios based upon the reasonable beliefs of the third-party provider are not a guarantee of future performance. Actual results may differ materially from those anticipated in forward-looking or past performance statements. IC Markets makes no representation or warranty and assumes no liability as to the accuracy or completeness of the information provided, nor any loss arising from any investment based on a recommendation, forecast or any information supplied by any third-party.
NZDCAD trade ideas


NZD/CAD Daily AnalysisPrice is moving within an ascending channel with price now testing support.
Look for potential buy setups after a change of sentiment on the smaller time frames if this meets your strategy rules.
This is an idea of what may happen. You should always trade with a well tested and profitable trading strategy using good risk management.

NZDCAD ShortsMarket structure bearish on HTFs 3
Entry at both DW
Weekly Rejection at AOi
Daily Rejection at AOi
Previous Structure point Daily
Around Psychological Level 0.82000
H4 EMA retest
H4 Candlestick rejection
Levels 4.3
Entry 105%
REMEMBER : Trading is a Game Of Probability
: Manage Your Risk
: Be Patient
: Every Moment Is Unique
: Rinse, Wash, Repeat!
: Christ is King.
NZDCAD Will Fall! Sell!
Please, check our technical outlook for NZDCAD.
Time Frame: 2h
Current Trend: Bearish
Sentiment: Overbought (based on 7-period RSI)
Forecast: Bearish
The price is testing a key resistance 0.816.
Taking into consideration the current market trend & overbought RSI, chances will be high to see a bearish movement to the downside at least to 0.813 level.
P.S
The term oversold refers to a condition where an asset has traded lower in price and has the potential for a price bounce.
Overbought refers to market scenarios where the instrument is traded considerably higher than its fair value. Overvaluation is caused by market sentiments when there is positive news.
Disclosure: I am part of Trade Nation's Influencer program and receive a monthly fee for using their TradingView charts in my analysis.
Like and subscribe and comment my ideas if you enjoy them!

How To Trade Forex-Part1In this chart i show you my frustration as i am trying to find a better way to scan for Forex trades but at the end of the chart we can see the light at the end of the tunnel.
Because i am now able to scan for Forex trading using:
1-Candle stick patterns
2-Directional Movement indicator
3-Moving Averages.
Study this chart in order
to see how i have really broken it down to
a simple science
I will try to make a video to demonstrate this
system.
Rocket boost this content to learn more.
Disclaimer:Trading is risky please
learn risk management and profit taking
strategies.Also feel free to use a simulation trading
account before you trade with real money.

NZD-CAD Free Signal! Sell!
Hello,Traders!
NZD-CAD made a bearish
Breakout of the key horizontal
Level around 0.8182 so we are
Bearish biased so lets let the
Pair make a pullback and
Retest the lower bound of
The new resistance level
And from there we can go
Short with the Take Profit
Of 0.8136 and the Stop
Loss of 0.8196
Sell!
Comment and subscribe to help us grow!
Check out other forecasts below too!
Disclosure: I am part of Trade Nation's Influencer program and receive a monthly fee for using their TradingView charts in my analysis.

NZDCAD Potential Bullish ReversalNZDCAD price seems to exhibit signs of a potential Bullish Reversal on the shorter timeframes if the price action forms a credible Higher High with multiple confluences from key Fibonacci and Support levels.
Trade Plan :
Entry @ 0.822500
Stop Loss @ 0.81600
TP 0.9 - 1 @ 0.82830 - 0.82890

Bearish drop?NZD/CAD has reacted of the pivot and could drop to the 1st support.
Pivot: 0.8201
1st Support: 0.8078
1st Resistance: 0.8309
Risk Warning:
Trading Forex and CFDs carries a high level of risk to your capital and you should only trade with money you can afford to lose. Trading Forex and CFDs may not be suitable for all investors, so please ensure that you fully understand the risks involved and seek independent advice if necessary.
Disclaimer:
The above opinions given constitute general market commentary, and do not constitute the opinion or advice of IC Markets or any form of personal or investment advice.
Any opinions, news, research, analyses, prices, other information, or links to third-party sites contained on this website are provided on an "as-is" basis, are intended only to be informative, is not an advice nor a recommendation, nor research, or a record of our trading prices, or an offer of, or solicitation for a transaction in any financial instrument and thus should not be treated as such. The information provided does not involve any specific investment objectives, financial situation and needs of any specific person who may receive it. Please be aware, that past performance is not a reliable indicator of future performance and/or results. Past Performance or Forward-looking scenarios based upon the reasonable beliefs of the third-party provider are not a guarantee of future performance. Actual results may differ materially from those anticipated in forward-looking or past performance statements. IC Markets makes no representation or warranty and assumes no liability as to the accuracy or completeness of the information provided, nor any loss arising from any investment based on a recommendation, forecast or any information supplied by any third-party.

NZDCAD is Bearish, strategy this weekNZDCAD was bullish in March, but selling pressure was seen last few days. It forms evening tarts in weekly view and already has a broken triangle pattern.
It is already playing Long time old Divergence in Daily View, and currently forming LH - LL.
In Hourly view, it has already tested Support multiple times, forming a triangle.
from last 5 hours itis forming spinners.
my strategy is to take short position after confirmation (break of support).

NZDCAD is in the Selling Direction after Breaking SupportHello Traders
In This Chart nzdcad HOURLY Forex Forecast By FOREX PLANET
today NZDCAD analysis 👆
🟢This Chart includes_ (NZDCAD market update)
🟢What is The Next Opportunity on NZDCAD Market
🟢how to Enter to the Valid Entry With Assurance Profit
This CHART is For Trader's that Want to Improve Their Technical Analysis Skills and Their Trading By Understanding How To Analyze The Market Using Multiple Timeframes and Understanding The Bigger Picture on the Charts

NZDCAD - Bullish Rectangular boxThis pair has recently made good bullish breakout from its previous trend. After bearish divergence formation the pair retraced and is in consolidation phase to dilute the divergence.
Entry can be taken at break of consolidation box SL below the box.

NZDCAD - Looking for bearish continuationMy chart describes exactly what I am seeing.
My own bias is to the downside.
This is not a trade recommendation, merely my own analysis. Trading carries a high level of risk, so only trade with money you can afford to lose and carefully manage your capital and risk. If you like my idea, please give a “boost” and follow me to get even more. Please comment and share your thoughts too!!
It’s not whether you are right or wrong, but how much money you make when you are right and how much you lose when you are wrong – George Soros

short setup on nzdcadNZDCAD Has just drop to a bearish movement on a weekly timeframe; there is currently a continuous bearish movement on a daily TF
NZDCAdhello trader, price is reaching near the 4hr OB. the price may reverse from this point since the price is still uptrend, this could be correction for htf day-week. wait for proper reversal when candle break out with fvg for best result...
good luck..
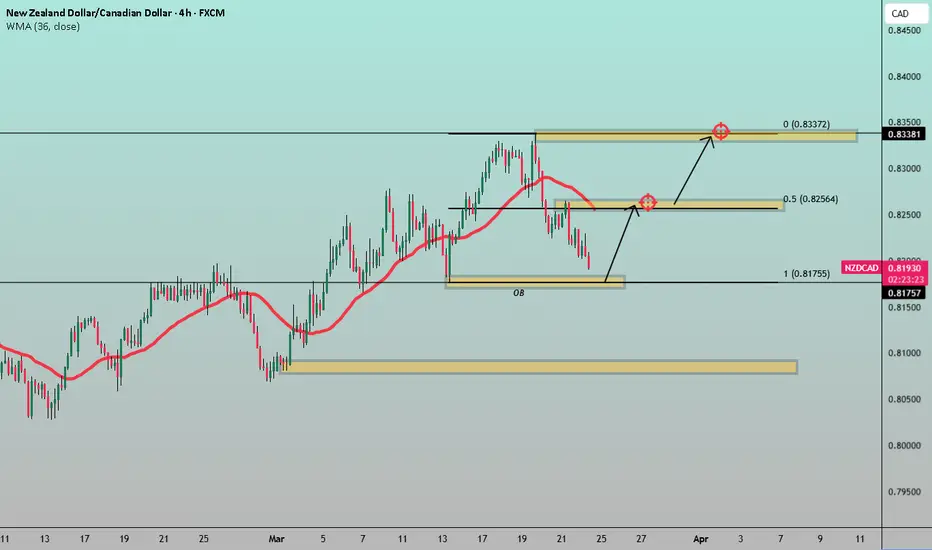
EXPECT FOR A BULLISH TRENDNZDCAD gave us inv. H&Ss pattern(D1) and started to do HH and HL so now I'm expecting for price to start going up, let see what patterns are gonna form from our 51% and 61% zone.
NB:NO REVERSAL PATTERNS NO ENTRY.

NZD/CAD H1 | Approaching overlap resistanceNZD/CAD is rising towards an overlap resistance and could potentially reverse off this level to drop lower.
Sell entry is at 0.8205 which is an overlap resistance that aligns with the 23.6% Fibonacci retracement.
Stop loss is at 0.8240 which is a level that sits above the 38.2% Fibonacci retracement and a swing-high resistance.
Take profit is at 0.8165 which is a swing-low support.
High Risk Investment Warning
Trading Forex/CFDs on margin carries a high level of risk and may not be suitable for all investors. Leverage can work against you.
Stratos Markets Limited (www.fxcm.com):
CFDs are complex instruments and come with a high risk of losing money rapidly due to leverage. 63% of retail investor accounts lose money when trading CFDs with this provider. You should consider whether you understand how CFDs work and whether you can afford to take the high risk of losing your money.
Stratos Europe Ltd (www.fxcm.com):
CFDs are complex instruments and come with a high risk of losing money rapidly due to leverage. 63% of retail investor accounts lose money when trading CFDs with this provider. You should consider whether you understand how CFDs work and whether you can afford to take the high risk of losing your money.
Stratos Trading Pty. Limited (www.fxcm.com):
Trading FX/CFDs carries significant risks. FXCM AU (AFSL 309763), please read the Financial Services Guide, Product Disclosure Statement, Target Market Determination and Terms of Business at www.fxcm.com
Stratos Global LLC (www.fxcm.com):
Losses can exceed deposits.
Please be advised that the information presented on TradingView is provided to FXCM (‘Company’, ‘we’) by a third-party provider (‘TFA Global Pte Ltd’). Please be reminded that you are solely responsible for the trading decisions on your account. There is a very high degree of risk involved in trading. Any information and/or content is intended entirely for research, educational and informational purposes only and does not constitute investment or consultation advice or investment strategy. The information is not tailored to the investment needs of any specific person and therefore does not involve a consideration of any of the investment objectives, financial situation or needs of any viewer that may receive it. Kindly also note that past performance is not a reliable indicator of future results. Actual results may differ materially from those anticipated in forward-looking or past performance statements. We assume no liability as to the accuracy or completeness of any of the information and/or content provided herein and the Company cannot be held responsible for any omission, mistake nor for any loss or damage including without limitation to any loss of profit which may arise from reliance on any information supplied by TFA Global Pte Ltd.
The speaker(s) is neither an employee, agent nor representative of FXCM and is therefore acting independently. The opinions given are their own, constitute general market commentary, and do not constitute the opinion or advice of FXCM or any form of personal or investment advice. FXCM neither endorses nor guarantees offerings of third-party speakers, nor is FXCM responsible for the content, veracity or opinions of third-party speakers, presenters or participants.

NZDCAD Long BiasHi all,
Just a nice techincal level on Daily / H4 on NZDCAD for a potential Long position.
A strong uptrend with impulsive bullish candles.
Let's see how it goes.
Trade safe!

NZDCAD is BullishPrice was in a downtrend, however the bulls seem to have answered the call and are trying to assume control of the price action. If previous lower high is broken with good volume then we can expect a bullish reversal as per Dow theory. Targets are mentioned on the chart.

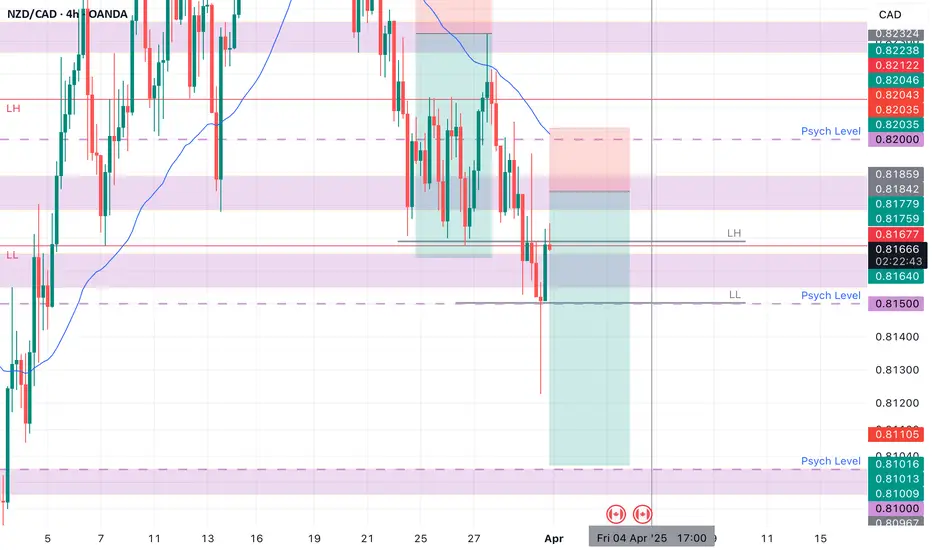
NZD/CAD BEST PLACE TO SELL FROM|SHORT
Hello, Friends!
NZD/CAD is making a bullish rebound on the 1H TF and is nearing the resistance line above while we are generally bearish biased on the pair due to our previous 1W candle analysis, thus making a trend-following short a good option for us with the target being the 0.817 level.
Disclosure: I am part of Trade Nation's Influencer program and receive a monthly fee for using their TradingView charts in my analysis.
✅LIKE AND COMMENT MY IDEAS✅

Bearish breakout?NZD/CAD is reacting off the pivot and a breakout could potentially lead the price to drop to the 1st support.
Pivot: 0.8194
1st Support: 0.80792
1st Resistance: 0.82654
Risk Warning:
Trading Forex and CFDs carries a high level of risk to your capital and you should only trade with money you can afford to lose. Trading Forex and CFDs may not be suitable for all investors, so please ensure that you fully understand the risks involved and seek independent advice if necessary.
Disclaimer:
The above opinions given constitute general market commentary, and do not constitute the opinion or advice of IC Markets or any form of personal or investment advice.
Any opinions, news, research, analyses, prices, other information, or links to third-party sites contained on this website are provided on an "as-is" basis, are intended only to be informative, is not an advice nor a recommendation, nor research, or a record of our trading prices, or an offer of, or solicitation for a transaction in any financial instrument and thus should not be treated as such. The information provided does not involve any specific investment objectives, financial situation and needs of any specific person who may receive it. Please be aware, that past performance is not a reliable indicator of future performance and/or results. Past Performance or Forward-looking scenarios based upon the reasonable beliefs of the third-party provider are not a guarantee of future performance. Actual results may differ materially from those anticipated in forward-looking or past performance statements. IC Markets makes no representation or warranty and assumes no liability as to the accuracy or completeness of the information provided, nor any loss arising from any investment based on a recommendation, forecast or any information supplied by any third-party.

NZDCAD: Bullish Continuation & Long Trade
NZDCAD
- Classic bullish formation
- Our team expects growth
SUGGESTED TRADE:
Swing Trade
Buy NZDCAD
Entry Level - 0.8206
Sl - 0.8171
Tp - 0.8262
Our Risk - 1%
Start protection of your profits from lower levels
Disclosure: I am part of Trade Nation's Influencer program and receive a monthly fee for using their TradingView charts in my analysis.
❤️ Please, support our work with like & comment! ❤️

NZD/CAD - Long Trade IdeaCurrently have been watching this market for a few weeks now and we have been slow progressing into this level.
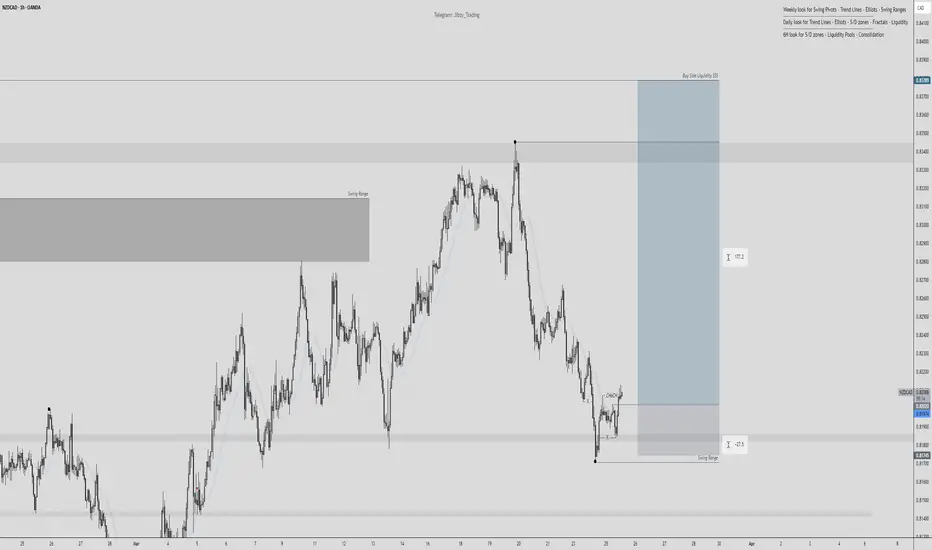
Smaller Time frames have just displayed our change of character indicating that we will be starting to see a little more volume come in for buyers. After already taking out the previous high I will be looking for entries soon looking to sweep Buy side Liquidity
Price has already swept Sell Side Liquidity so now we will let time now just make its move'
Good luck to any traders that might follow