BUY NZDCAD - CAD still weak Trader Tom, a technical analyst with over 16 years’ experience, explains his trade idea using price action and a top down approach. This is one of many trades so if you would like to see more then please follow us and hit the boost button.
We are proud to be an OFFICIAL Trading View partner so please support the channel by using the link below and unleash the power of trading view today!
www.tradingview.com
NZDCAD trade ideas

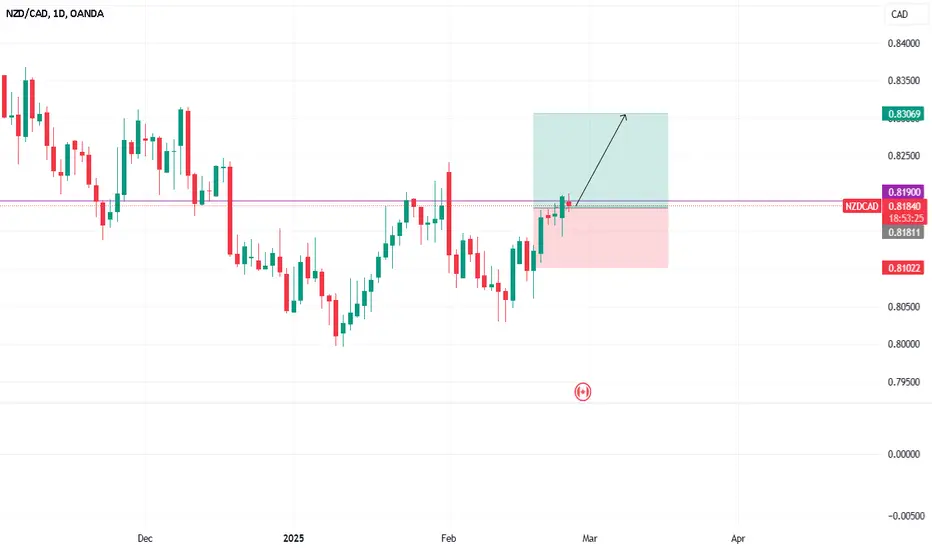
NZDCAD - DAILY CHARThi everyone
here i just share about NZDCAD pair
the daily resist already break
so i think it will continue BULLish
so i just prepare LONG right now
disclaimer
what i say is not always true
im beginnerrrr
be smart
save your money
NZDCAD Sell Setup at 0.8167I'm looking to sell NZDCAD at 0.8167, expecting a bearish move based on key technical factors.
🔹 Reasons for Entry:
✅ Resistance Zone: The 0.8167 level has acted as a strong resistance in the past, making it a potential reversal point.
✅ Trend Structure: The pair is in a bearish trend on the timeframe, forming lower highs.
✅ Moving Averages: Price is approaching the , adding confluence to the setup.
✅ Fibonacci Level: 0.8167 aligns with the retracement from the previous swing.
✅ Bearish Divergence: Possible divergence on , signaling weakness in the uptrend.
📉 Trade Plan:
Sell Limit: 0.8167
Stop Loss:
Take Profit:
Risk-Reward Ratio:
If price rejects this level, I expect a downside move towards .
What’s your outlook on NZDCAD? Let me know in the comments! 📊🔥

NZDCAD Buy setupOANDA:NZDCAD Overall bias on NZDCAD is bullish. Entry is based on the 4H bullish engulfing at the Daily AOI, with the 4H simultaneously rejecting the 0.81654 Daily AOI area.

Bullish bounce?NZD/CAD is falling towards the support level which is an overlap support that aligns with the 38.2% Fibonacci retracement and could bounce from this level to our take profit.
Entry: 0.8137
Why we like it:
There is an overap support level that aligns with the 38.2% Fibonacci retracement.
Stop loss: 0.8103
Why we like it:
There is a pullback support level that lines up witht he 61.8% Fibonacci retracement.
Take profit: 0.8195
Why we like it:
There is a pullback resistance level that aligns with the 161.8% Fibonacci extension.
Enjoying your TradingView experience? Review us!
Please be advised that the information presented on TradingView is provided to Vantage (‘Vantage Global Limited’, ‘we’) by a third-party provider (‘Everest Fortune Group’). Please be reminded that you are solely responsible for the trading decisions on your account. There is a very high degree of risk involved in trading. Any information and/or content is intended entirely for research, educational and informational purposes only and does not constitute investment or consultation advice or investment strategy. The information is not tailored to the investment needs of any specific person and therefore does not involve a consideration of any of the investment objectives, financial situation or needs of any viewer that may receive it. Kindly also note that past performance is not a reliable indicator of future results. Actual results may differ materially from those anticipated in forward-looking or past performance statements. We assume no liability as to the accuracy or completeness of any of the information and/or content provided herein and the Company cannot be held responsible for any omission, mistake nor for any loss or damage including without limitation to any loss of profit which may arise from reliance on any information supplied by Everest Fortune Group.

NZDCAD: Bullish Forecast Explained 🇳🇿🇨🇦
I see a nice inverted head & shoulders pattern on NZDCAD
on a daily time frame.
Its neckline was broken on Thursday last week with a high momentum bearish candle.
Probabilities will be high that the price will rise after its retest.
Goal - 0.82
❤️Please, support my work with like, thank you!❤️

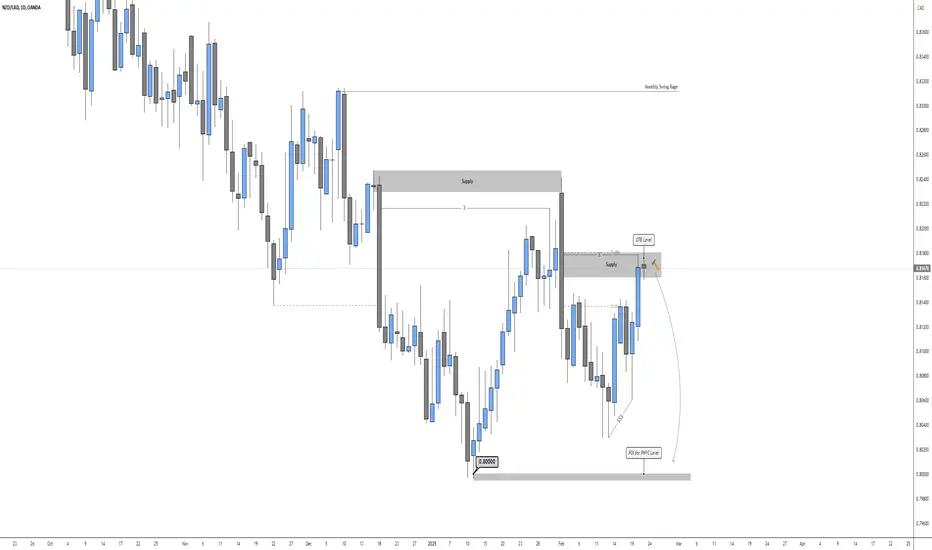
NZD/CAD - Strong Sell Setup (Weekly Outlook)Hi all, looking at the following chart in the Daily TF from NZD/CAD we can see that price is Bearish long term. Within the Weekly TF you will notice this is the finish pullback within this Bearish leg.
Price is currently displaying that both Buy side Liquidity levels have been taking meaning the only way is down. We are currently within a strong 4H Mitigation Block and wicked into our 71% range.
We are targeting the Support being a strong PHYC level.
Good luck to all the traders that decide to follow
Cheers

NZD-CAD Bullish Breakout! Buy!
Hello,Traders!
NZD-CAD is going up now
And the pair made a bullish
Breakout of the key horizontal
Level of 0.8142 and the
Breakout is confirmed
So we will be expecting a
Further move up
Buy!
Comment and subscribe to help us grow!
Check out other forecasts below too!

NZDCAD: Bearish Continuation is Expected! Here is Why:
Looking at the chart of NZDCAD right now we are seeing some interesting price action on the lower timeframes. Thus a local move down seems to be quite likely.
❤️ Please, support our work with like & comment! ❤️

LongUse proper risk management
Looks like good trade.
Lets monitor.
Use proper risk management.
Disclaimer: only idea, not advice.

NZDCAD - Where I see it going nextJust based on simple TA, I foresee this pair moving in a similar direction as displayed on the chart. Let's see accurate I am at future forecasting this pair.
That's it - That's all
Trade Safe.

Bullish bounce?NZD/CAD is falling towards the pivot and could bounce to the 1st resistance.
Pivot: 0.8072
1st Support: 0.8032
1st Resistance: 0.8138
Risk Warning:
Trading Forex and CFDs carries a high level of risk to your capital and you should only trade with money you can afford to lose. Trading Forex and CFDs may not be suitable for all investors, so please ensure that you fully understand the risks involved and seek independent advice if necessary.
Disclaimer:
The above opinions given constitute general market commentary, and do not constitute the opinion or advice of IC Markets or any form of personal or investment advice.
Any opinions, news, research, analyses, prices, other information, or links to third-party sites contained on this website are provided on an "as-is" basis, are intended only to be informative, is not an advice nor a recommendation, nor research, or a record of our trading prices, or an offer of, or solicitation for a transaction in any financial instrument and thus should not be treated as such. The information provided does not involve any specific investment objectives, financial situation and needs of any specific person who may receive it. Please be aware, that past performance is not a reliable indicator of future performance and/or results. Past Performance or Forward-looking scenarios based upon the reasonable beliefs of the third-party provider are not a guarantee of future performance. Actual results may differ materially from those anticipated in forward-looking or past performance statements. IC Markets makes no representation or warranty and assumes no liability as to the accuracy or completeness of the information provided, nor any loss arising from any investment based on a recommendation, forecast or any information supplied by any third-party.

NZDCADWe can attempt to short NZDCAD as it makes LH , also 0.618 FIB level intact indicate that it moves downward.
SL , TP mention in chart.

NZDCAD FORECASTI love the way that the structures are looking like. 4H Timeframe gives us a clear picture of what the market is likely to do next. The commitment from above is exciting. With this price nature, I'm waiting for an entry from the lower timeframes.
Let's see how it goes, guys!

NZD-CAD Will Go Down! Sell!
Hello,Traders!
NZD-CAD went up sharply
And hit a horizontal resistance
Level of 0.8147 so we are
Locally bearish biased
And as we are already
Seeing a bearish reaction
We will be expecting
A local bearish move down
Sell!
Comment and subscribe to help us grow!
Check out other forecasts below too!

NZDCAD H1 IdeaPotential for a bullish pullback on the NZDCAD which could lead to a price movement towards the resistance level at 0.81600. BUY levels from 0.80800

NZDCAD: Bearish Continuation
Balance of buyers and sellers on the NZDCAD pair, that is best felt when all the timeframes are analyzed properly is shifting in favor of the sellers, therefore is it only natural that we go short on the pair.
❤️ Please, support our work with like & comment! ❤️

NZDCAD Daily: triple confluence..The loonie has been kicking down the kiwi since Oct last year but they are putting a fight trying to recover some losses. We saw a false breakout on the TL strongly rejected by the loonie. Now (21:03 AEST) there is a "triple" confluence between the TL, the SMA(50) and the daily PP. This pair will be a bit trick to trade. Although the technical side follows some "logic"(as if FX has logic) during this week we have some strong Fundamentals. On 18th we have the BoC CPI(YoY); on the 19th we have the RBNZ Interest Rates(and the market is expecting a cut), so those one can crack all the technical "logic" so be careful.

SELL NZDCADIn a H1, the price has reached the supply area, in 15m, it has taken liq then has broken the low, it s now retesting and drop. Let us how it will play

NZD_CAD SHORT FROM RESISTANCE|
✅NZD_CAD is going up now
But a strong resistance level is ahead at 0.8148
Thus I am expecting a pullback
And a move down towards the target at 0.8110
SHORT🔥
✅Like and subscribe to never miss a new idea!✅

NZDCAD reverse its trend.Already break its LAST LOWER HIGH after a BULLISH DIVERGENCE.
.DOUBLE BOTTOM pattern made.
.Wait for pre size entry by a buy limit

