NZD/CAD Setup Price broke below the consolidation channel, retested the support at 0.82330, and is expected to continue down toward the target at 0.81599. Bearish momentum is in play.
NZDCAD trade ideas

NZD/CAD BULLS ARE GAINING STRENGTH|LONG
NZD/CAD SIGNAL
Trade Direction: long
Entry Level: 0.820
Target Level: 0.824
Stop Loss: 0.817
RISK PROFILE
Risk level: medium
Suggested risk: 1%
Timeframe: 2h
Disclosure: I am part of Trade Nation's Influencer program and receive a monthly fee for using their TradingView charts in my analysis.
✅LIKE AND COMMENT MY IDEAS✅

NZDCAD--LONG--27_07_25--breaking of descending trendline (orange line)
--entry around 0.82063
--TP=0.83284

NZDCAD Long Now!📌 Instrument & Timeframe
NZD/CAD – 4H timeframe
Overall trend across multiple timeframes is noted as bullish (W, D, 12H, 6H, 4H all bullish).
📈 Market Structure
Price previously moved within a descending channel (drawn by two black trendlines) but has broken out to the upside.
After the breakout, price retraced back near a key area (just above the 200 EMA / red line) and is forming a smaller bull flag or descending wedge, indicating a potential continuation.
🔥 Area of Interest
Weekly AOI (Area of Interest) marked around 0.8180 – 0.8200 zone has acted as strong support.
Price reacted bullishly from that AOI, confirming buyers stepped in.
✅ Trade Bias
All higher timeframes (W, D, 12H, 6H, 4H) are bullish, so the bias is long.

NZDCAD Long Now!I believe it will reach the 83000 target, it may still retest the level before going to the target, but I have all the confimation for a long here.

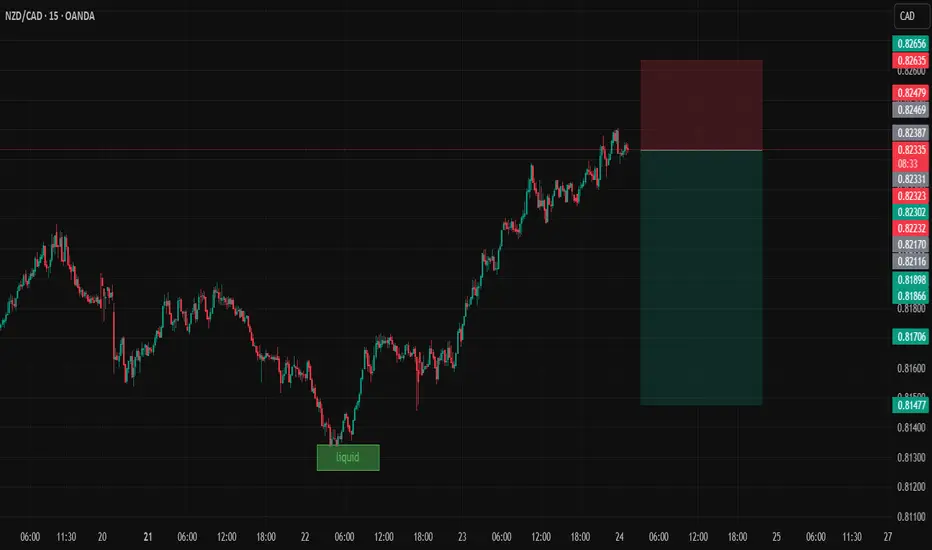
NZDCADDate:
July 24,2025
Session:
Tokyo and London session
Pair:
NZDCAD
Bias:
Short
liquidity pool that is waiting to be swept this week. Looks like price is gonna be magnetized towards that pool level during London and Tokyo. The trade may even stretch into NYC.
Entry: 0.82331
Stop Loss: 0.82635
Target: 0.81475
RR: 2.81
NZD_CAD POTENTIAL SHORT|
✅NZD_CAD has been growing recently
And the pair seems locally overbought
So as the pair is approaching
A horizontal resistance of 0.8260
Price decline is to be expected
SHORT🔥
✅Like and subscribe to never miss a new idea!✅
Disclosure: I am part of Trade Nation's Influencer program and receive a monthly fee for using their TradingView charts in my analysis.

NZDCAD Bullish Breakout!
HI,Traders !
#NZDCAD was trading
Beneath the falling resistance
Line but now we are seeing a
Bullish breakout so we are
Now locally bullish biased
And we will be expecting a
Further bullish move up !
Comment and subscribe to help us grow !

NZDCAD Long Trade Risking 1% to make 1.37%OANDA:NZDCAD Long Trade, with my back testing of this strategy, it hits multiple possible take profits, manage your position accordingly.
Note: Manage your risk yourself, its risky trade, see how much your can risk yourself on this trade.
Use proper risk management
Looks like good trade.
Lets monitor.
Use proper risk management.
Disclaimer: only idea, not advice

NZDCAD 1HR BAT HARMONICBAT Harmonic pattern completed on 1H timeframe.
2 Take profits shown on the chart
Trade Active

NZDCAD: Patience Before the PushNZDCAD on the 1H chart just completed a clean liquidity sweep below the previous day’s low. That long wick aggressively took out resting sell stops before price sharply reversed.
We’ve now seen a break of structure to the upside, showing a possible shift in market direction. Price is currently pulling back toward two visible imbalance zones (iFVGs), both sitting just below the previous day’s low.
If price trades into these iFVGs and gives us a clear bullish confirmation like a bullish engulfing candle, a rejection wick, or a strong break of structure on lower timeframes, we could look for continuation toward the liquidity above the highs.
📌 Key Levels
• Liquidity sweep below PDL
• Bullish break of structure
• iFVGs aligning as potential entry zones
• Final target: liquidity resting near 0.81900
🧠 Psychology Tip
The best trades don’t need to be forced. Wait for confirmation. A setup without a signal is just a theory. Protect your capital, trade your plan, and trust the process.

NZDCAD: A Short Term Bearish Perspective NZDCAD: A Short Term Bearish Perspective
NZDCAD reached a strong zone near 0.8205 and reached
Given that the trend is still bearish and Canada continues to print strong data the chances are that it can drop further in the short term.
The chances are that it can drop further during the U.S trading session given that the economic calendar is very poor today.
You may find more details in the chart!
Thank you and Good Luck!
PS: Please support with a like or comment if you find this analysis useful for your trading day
Disclosure: I am part of Trade Nation's Influencer program and receive a monthly fee for using their TradingView charts in my analysis.

NZDCAD Buy?? it looks juicy Hello please do not aim for the top of the range!!
Now because its NZDCAD it might look choppy and it might be choppy.


NZDCAD in bearish rallythe pair is making LHs and LLs just following DOW theory right now the price has marked its LH and now it is towards marking LL and with that a simple trade idea has been shown on the chart

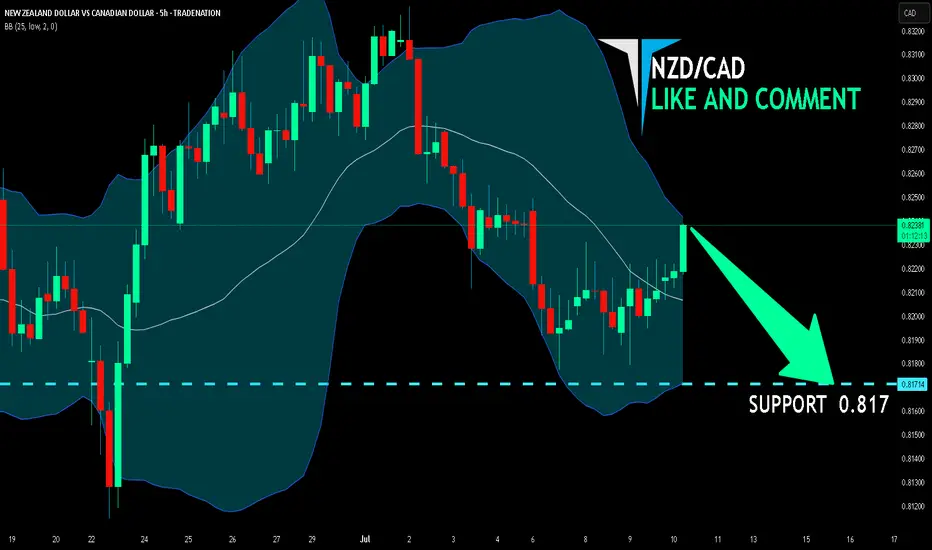
NZD/CAD SELLERS WILL DOMINATE THE MARKET|SHORT
Hello, Friends!
NZD/CAD pair is trading in a local uptrend which we know by looking at the previous 1W candle which is green. On the 5H timeframe the pair is going up too. The pair is overbought because the price is close to the upper band of the BB indicator. So we are looking to sell the pair with the upper BB line acting as resistance. The next target is 0.817 area.
Disclosure: I am part of Trade Nation's Influencer program and receive a monthly fee for using their TradingView charts in my analysis.
✅LIKE AND COMMENT MY IDEAS✅
NZDCAD bearish continuatiuonPrice was consolidating in the last 2 months, now it finally broke the level and got the retest waiting for a beutiful Bearsih Engulfing 30M,1H,2H to enter this trade.
very clear trade for me this week, it has to start now the downtrend.
---
### 🔎 **Multi‑timeframe Bias**
* **Weekly:** Bullish (but higher‑timeframe bullishness often takes longer to play out; intraday moves can still be bearish).
* **Daily:** Bearish
* **12H:** Bearish
* **6H:** Bearish
* **4H:** Bearish
✅ **Result:** 80% of your major timeframes are **aligned bearish**, giving you strong confluence to look for sells rather than buys.
---
### 📉 **Structure and Price Action**
* **Market Structure:**
Price is making **lower highs and lower lows** on the 4H and 1H timeframes, which confirms a **downtrend** in the short/medium term.
* **Current Zone:**
Price is currently reacting from a **Weekly Area of Interest (AOI)**, a previous support now acting as resistance.
* **Bearish Rejection:**
The recent move up into the AOI has been rejected, shown by the price failing to break above the resistance zone and starting to turn down.
---
### 📊 **Moving Averages**
* **50 EMA (blue) is below the 200 EMA (red):** classic bearish alignment.
* Price is currently **under the 200 EMA** and testing the 50 EMA from above — if it breaks back below, this often signals momentum returning to the downside.
---
### 📐 **Risk‑Reward and Setup**
* You’ve marked a **short entry** from the AOI, with:
* **Stop Loss** above the resistance zone (red area)
* **Take Profit** targeting lower liquidity levels (green area near 0.8110)
* The projected move matches the dominant trend direction, increasing probability.

NZDCAD TRADE SETUPWait for retest the entry level and bearish momentum candle then take a trade for Sell otherwise skip this setup

SELL NZDCAD now for a 4h time frame bearish trend continuationSELL NZDCAD now for a four hour time frame bearish trend continuation..........
STOP LOSS: 0.8180
This sell trade setup is based on hidden bearish divergence trend continuation trading pattern...
Always remember, the trend is your friend, so whenever you can get a signal that the trend will continue, then good for you to be part of it
TAKE PROFIT : take profit will be when the trend comes to an end, feel from to send me a direct DM if you have any question about take profit or anything.
Remember to risk only what you are comfortable with….....trading with the trend, patient and good risk management is the key to success here

NZD/CADNZD/CAD Has Retraced Into My 2h/4h Orderblock And Made A Market Structure Shift To The Upside For A Possible Move Higher Towards The Higher Timeframe Fair Value Gap. I Will Look For Longs Form This Zone And Then Wait For A Market Structure Shift To The Downside To Look For Short Entries To My Daily OrderBlock Which Sits Between 0.79705 - 0.78667. Once There I Will Look For Long Positions.
Trade Carefully HK

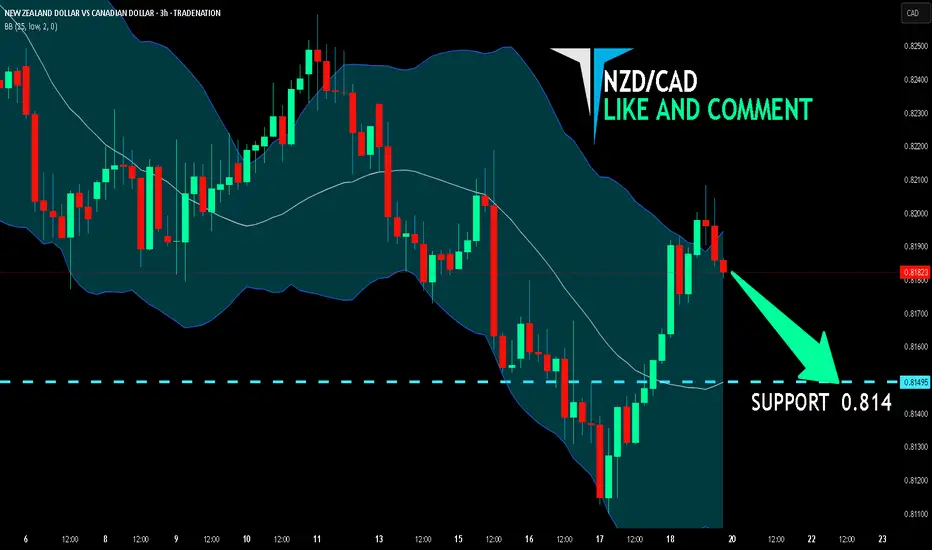
NZD/CAD BEARS ARE GAINING STRENGTH|SHORT
Hello, Friends!
NZD/CAD is trending down which is obvious from the red colour of the previous weekly candle. However, the price has locally surged into the overbought territory. Which can be told from its proximity to the BB upper band. Which presents a great trend following opportunity for a short trade from the resistance line above towards the demand level of 0.814.
Disclosure: I am part of Trade Nation's Influencer program and receive a monthly fee for using their TradingView charts in my analysis.
✅LIKE AND COMMENT MY IDEAS✅
NZDCADThis is a 1-hour chart of NZDCAD, and you’ve clearly marked a descending channel with multiple respected touches on both trendlines — showing clean market structure.
Analysis:
- Price is approaching the upper boundary of the descending channel again.
- There’s a potential supply zone just above current price.
- The blue projection suggests a possible rejection from that upper zone, continuing the overall bearish trend.
- Repeated reactions at the channel edges signal strong technical respect.
What to Do Next:
- Wait for bearish confirmation (e.g. rejection wick, bearish engulfing) at the upper trendline/supply zone.
- If confirmed, enter a sell trade with targets toward the lower boundary of the channel.
- Place stop-loss just above the supply zone or last swing high.
Suggested Caption for Social Media:
"NZDCAD playing beautifully within this descending channel. Watching closely for a bearish reaction at this key zone. Patience is power in trading. Let the market speak. 📉🔥 #ForexAnalysis #NZDCAD #PriceAction #SmartTrading"
Let me know if you want it in a more casual or motivational tone.

BuyRejection Level
Daily Volume
Market Structure Shift
London Session
Trend Line Break
Untapped Order Point
