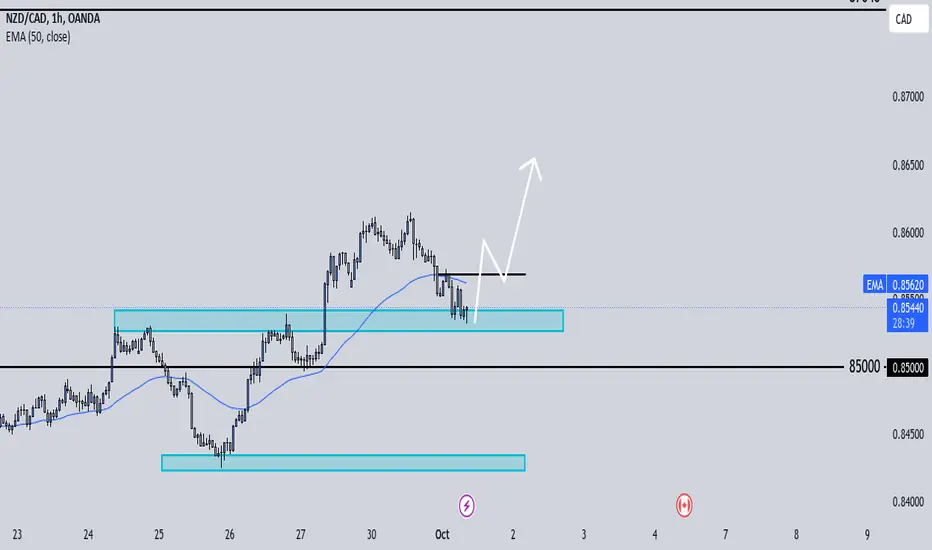
NZDCAD - A Bull Trap after a Bear Trap?NZDCAD continues its bullish run and is entering into the Parabolic trend zone.
There have been signs of bearish momentum divergences on the indicators which has led people into shorting prematurely and being caught in a bear trap.
Many short traders are watching in anticipation of a violent move to compensate for the continued fake-outs. It's proximity to the last pivot high could result in another move with either a bull trap or a breakout. Patience needed.
NZDCAD trade ideas

NZD CADTHIS IS MY SETUP FOR NZD CAD
I use Fibonacci to get these extreme points and my preferred one is 75% retracement, with a risk-reward of 1:3.
Trade carefully
This is not financial advice, DYOR.

NzdCad Trade IdeaNc at the moment is extremely bullish at the moment. NC longs are definitely valid here as long price can respect the retest and flip smaller time frame bearish structures to bullish to then be in sync with the higher time frame trend. If price comes back down the current level its at then we can expect price to drop below 85000 and possibly tap 84300 again.
Sell NZDCADSell limit order place at fib retracement level, Nzdcad making a bearish divergence at 1h timeframe and also break their last Higher Low.

NZDCAD short movePrice is currently rising towards our resistance level, any bearish reaction cloud leads to downside movement in price.

NZD/CAD Bearish Reversal: Break of Higher LowNZD/CAD has broken its higher low, and the bearish divergence suggests a potential bearish reversal.

@NZDCAD SELLFX:NZDCAD
NZD CAD SELL
ENTRY Area = 0.85600 - 0.85400
TP = 0.85000
SL = 0.86150
NZDCAD break trendline and will hit 0.85000 as a demand Area

NZDCAD FORECASTThis pair seems to have bigger potentials on the coming days, what we need to do is just to stay patient and wait, because in these areas most of people are tagged in and out, we need to wait for the confirmation as the market communicates every time!
I just appreciate you for taking time to follow my contents! Let's grow together

Bullish bounce?NZD/CAD is falling towards the support level which is a pullback support that slightly below the 38.2% Fibonacci retracement and could bounce from this level to our take profit.
Entry: 0.85288
Why we like it:
There is a pullback support level which is slightly below the 38.2% Fibonacci retracement.
Stop loss: 0.84756
Why we like it:
There is a pullback support level.
Take profit: 0.86072
Why we like it:
There is a pullback resistance level.
Enjoying your TradingView experience? Review us!
Please be advised that the information presented on TradingView is provided to Vantage (‘Vantage Global Limited’, ‘we’) by a third-party provider (‘Everest Fortune Group’). Please be reminded that you are solely responsible for the trading decisions on your account. There is a very high degree of risk involved in trading. Any information and/or content is intended entirely for research, educational and informational purposes only and does not constitute investment or consultation advice or investment strategy. The information is not tailored to the investment needs of any specific person and therefore does not involve a consideration of any of the investment objectives, financial situation or needs of any viewer that may receive it. Kindly also note that past performance is not a reliable indicator of future results. Actual results may differ materially from those anticipated in forward-looking or past performance statements. We assume no liability as to the accuracy or completeness of any of the information and/or content provided herein and the Company cannot be held responsible for any omission, mistake nor for any loss or damage including without limitation to any loss of profit which may arise from reliance on any information supplied by Everest Fortune Group.

NZDCAD - Long from bullish order block !! Hello traders!
‼️ This is my perspective on NZDCAD.
Technical analysis: Here we are in a bullish market structure from 4H timeframe perspective, so I look for a long. My point of interest is price to fill the imbalance lower and then to reject from bullish OB.
Like, comment and subscribe to be in touch with my content!

NZDCAD idea pt1This weak is looking even slower than last week but last week we still managed to catch a move so let's see if we get the same thing this week. All timeframes in sync need price to get the that zone and round number and hopefully hold to create new highs ⚐

NZD_CAD LOCAL SHORT|
✅NZD_CAD went up just as
I predicted in my previous analysis
But is now approaching a supply level of 0.8624
So according to our strategy
We will be looking for the signs of the reversal in the trend
To jump onto the bearish bandwagon just on time to get the best
Risk reward ratio for us
SHORT🔥
✅Like and subscribe to never miss a new idea!✅

NZD/CADFull analysis of the NZD/CAD pair
1- An ascending price channel on a 4-hour frame
2- Touch the left channel from the top
3- The emergence of strong display areas
4- The appearance of divergence on the RSI and MACD indicators
So we start looking for deals to sell

NZD_CAD BULLISH BREAKOUT|LONG|
✅NZD_CAD is trading in an
Uptrend and we are seeing a
Strong bullish breakout of the
Key horizontal level of 0.8520
Which is now a support so
After a potential local pullback
We will be expecting a
Further bullish continuation
LONG🚀
✅Like and subscribe to never miss a new idea!✅

Ncad more upside to come,it seems :)Hello fellow traders , my regular and new friends!
Welcome and thanks for dropping by my post.
Should be getting to see more upside
Do check out my recorded video (in trading ideas) for the week to have more explanation in place.
Do Like and Boost if you have learnt something and enjoyed the content, thank you!
-- Get the right tools and an experienced Guide, you WILL navigate your way out of this "Dangerous Jungle"! --
*********************************************************************
Disclaimers:
The analysis shared through this channel are purely for educational and entertainment purposes only. They are by no means professional advice for individual/s to enter trades for investment or trading purposes.
*********************************************************************

NZDCAD ChartThere is Bullish Trend, But RSI forms Bearish Divergence and also there is Bearish Pattern of Double Top. Will Take Short entry at the Break of last HL. Trade Plan According to this Analysis and my Risk Reward.

NZDCAD SHORT 0.84040 TP Chinese stimulus & Middle East tensions are making oil rise thus providing support to the canadian dollar. Oil is Canada's #1 export. When oil rises so does CAD. 0.84040 TP

NZDCADWhat are the odds of this pair buying till those Zones. We are in a key fib zone. we have oprder block ast that point. hoping to join tomorrow


NZDCADWe can attempt to short NZDCAD from specified level as it break HL , also bearish divergence occur indicate that it moves downward.
SL , TP mention in chart.

NZDCAD BULLSAt our POI demand zone on the Daily and 4 hour chart. Price will pull back to the demand that caused a BOS. Wait for price to close with a reversal candlestick on the demand zone for buys!

NZDCAD 4HThe price has reacted after reaching the ceiling of the channel. The upward trend line has been broken in the four-hour period. We are waiting for the price retest to 0.5 and 0.618 Fibonacci. If we see the trigger, we will enter the Sell transaction.

Bullish bounce off 50% Fibonacci support?NZD/CAD is reacting off the pivot and could potentially rise to the 1st resistance which acts as a pullback resistance.
Pivot: 0.8368
1st Support: 0.8368
1st Resistance: 0.8488
Risk Warning:
Trading Forex and CFDs carries a high level of risk to your capital and you should only trade with money you can afford to lose. Trading Forex and CFDs may not be suitable for all investors, so please ensure that you fully understand the risks involved and seek independent advice if necessary.
Disclaimer:
The above opinions given constitute general market commentary, and do not constitute the opinion or advice of IC Markets or any form of personal or investment advice.
Any opinions, news, research, analyses, prices, other information, or links to third-party sites contained on this website are provided on an "as-is" basis, are intended only to be informative, is not an advice nor a recommendation, nor research, or a record of our trading prices, or an offer of, or solicitation for a transaction in any financial instrument and thus should not be treated as such. The information provided does not involve any specific investment objectives, financial situation and needs of any specific person who may receive it. Please be aware, that past performance is not a reliable indicator of future performance and/or results. Past Performance or Forward-looking scenarios based upon the reasonable beliefs of the third-party provider are not a guarantee of future performance. Actual results may differ materially from those anticipated in forward-looking or past performance statements. IC Markets makes no representation or warranty and assumes no liability as to the accuracy or completeness of the information provided, nor any loss arising from any investment based on a recommendation, forecast or any information supplied by any third-party.
