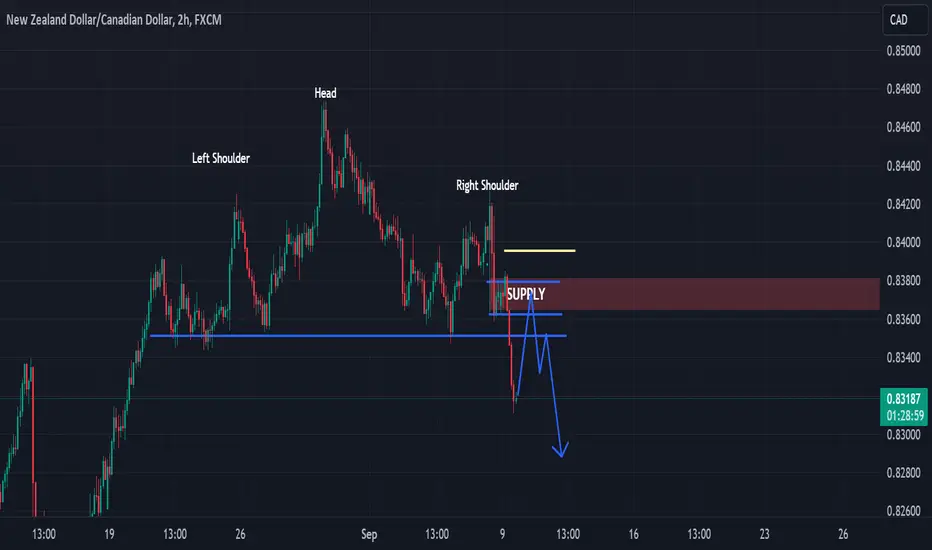
NZDCAD 2hI'm keeping an eye out for a potential bearish continuation if the price breaks below the support zone on the 2-hour timeframe.
NZDCAD trade ideas

IDEA NZDCAD SHORT POSITION HI TRADERS IDEA NZDCAD
Pair : NZDCAD
Position : SHORT ( SELL )
Entry Price : 0.83300
STOP LOSS @ 0.83525
TP 1 @ 0.83000
TP 2 @ 0.82780
TP 3 @ 0.82250 ( Trailing SL )


Nzdcad shortsVery simple analysis nzdcad has been in a big downtrend since November 2016 I'm looking to take this to 0.82070 or 0.81400 sl 0.83900


Flexablityit tooks three trades to catch the trend... you have to be very flexable with what you doing

NZDCAD SHORTSSPECIAL TRADE!!!
Market structure bearish on HTFs DH
Entry at both Weekly and Daily AOi
Weekly Rejection at AOi
Daily Rejection at AOi
Daily H&S Pattern (Retest of the Neckline)
Previous Daily Structure point
Around Psych Level 0.83500
H4 Candlestick rejection
Rejection from Previous structure
Levels 7.84
Entry 95%
REMEMBER : Trading is a Game Of Probability
: Manage Your Risk
: Be Patient
: Every Moment Is Unique
: Rinse, Wash, Repeat!
: Christ is King

NZD/CAD BEARISH BIASHi Smart Money Traders!
NZA/CAD reached a strong resistance level and failed to break it!
The price formed a head and shoulders pattern!
At the moment the is broken!
Therefore, I predict a bearish move 📉

Bearish on NZDCADThe pair has shown signs of bearish momentum, confirmation are already on the chart and is a good short to take.

NZDCAD Will Go Lower From Resistance! Sell!
Please, check our technical outlook for NZDCAD.
Time Frame: 2h
Current Trend: Bearish
Sentiment: Overbought (based on 7-period RSI)
Forecast: Bearish
The market is on a crucial zone of supply 0.834.
The above-mentioned technicals clearly indicate the dominance of sellers on the market. I recommend shorting the instrument, aiming at 0.831 level.
P.S
We determine oversold/overbought condition with RSI indicator.
When it drops below 30 - the market is considered to be oversold.
When it bounces above 70 - the market is considered to be overbought.
Like and subscribe and comment my ideas if you enjoy them!

NZDCAD BEARSContinuation of a downtrend. Pull-back to the zone, FVG filled. BSL taken. 20 EMA cross below 50 EMA ( 1 minute chart ).

NZD_CAD BEARISH BREAKOUT|SHORT|
✅NZD_CAD made a bearish
Breakout of the key horizontal
Level of 0.8350 which is now
A resistance and as we are now
Bearish biased we will be
Expecting a further move down
SHORT🔥
✅Like and subscribe to never miss a new idea!✅

NZDCAD BIASI REALLY DON'T LIKE RANGING MARKETS BUT THATS WHAT THIS MAKERT IS!!!!!
- I would like to support bearish prices due to the buy side that was swept.
- 4 HR looks bearish. I would sell it in that 4hr BREAKER.
- Waiting for this week to end would be the best option to determine where this Market is going.
- But during Asian Session I will take sell looking at a 15mins MSS to develop.
That's a C set up to me!!!!!!!

NZDCAD has entered into bearish phaseby breaking the support the pair has started a bearish trend. A potential zone has also been drawn at which the price can probably fall, 1:2 target can be achieved

Shifted bearishFrom the bullish market price mitigated the 4h order block at 0.84736 and reduced to provide us with displacement. The shift engineered a flip to supply zone for a bearish distribution. With the two break of structures in hand, this data tells us that we have a strong bearish market. Looking for a hike to sweep the liquidity and mitigate the rejection block for a clean bearish entry at 0.83955, with stop loss at 0.84355 and our target at 0.82155…

NZDCAD Simple Trading SetupsNZDCAD has dipped amongst NZD weakness within a long term uptrend cycle.
This has mostly came (Longer Term) due to Rates and their proposed changes.
Risk appetite currently around US/China rules.

Selling NZDCADHello traders this is just a simple break and retest trade.
Head and shoulders
Nice supply zone here which I expect price to retest it will also act as my liquidity/SL Zone.
The position of the pivot point is a very nice level which we can use to place our SL
NZD/CAD- 4hrs ( Sell Trade Target Range 150 PIP ) Pair Name : NZD/CAD
Time Frame : 4hrs Chart / Close
Scale Type : Large Scale
------
spreading knowledge among us and to clarify the most importan+t points of entry, exit and entry with more than 5 reasons
We seek to spread understanding rather than make money
Key Technical / Direction ( Short )
Type : Mid Term Swing
———————————
Bearish Reversal
0.83250 Area
Reasons
- Major Turn levl
- Visible Range hvn
- Channel Break
- Choch Zone
- Day / week low
Bullish Reversal
0.81500 Area
Reasons
- Major Turn level
- Pattern Target
- Choch Zone
- Quarters Area
- Fibo Golden


NZDCADCurrently on NZDCAD we are waiting for price during the upcoming week on the weekly timeframe to takeout the previous 3-months high or the high of the year to register a new high of the year then closing below the previous high, from there we are expecting price to distribute to the downside below the true year open maybe down to level 0.75000

NZDCAD - BULLISH ??hi everyone
here i just share a basic technical analysis
NZDCAD already break resist on H4 , and make a retest
so interesting !!!!
what do you think?
disclaimer
this is not a signal
be smart

NZDCAD BULLSABCD pattern. The low which is A broke structure. B was created as the new high, now C is a retracement to the demand zone that caused the BOS. No liquidity & no FVG!

Bearish reversal?NZD/CAD is rising towards the pivot which acts as an overlap resistance and could reverse to the pullback support.
Pivot: 0.84198
1st Support: 0.83475
1st Resistance: 0.84740
Risk Warning:
Trading Forex and CFDs carries a high level of risk to your capital and you should only trade with money you can afford to lose. Trading Forex and CFDs may not be suitable for all investors, so please ensure that you fully understand the risks involved and seek independent advice if necessary.
Disclaimer:
The above opinions given constitute general market commentary, and do not constitute the opinion or advice of IC Markets or any form of personal or investment advice.
Any opinions, news, research, analyses, prices, other information, or links to third-party sites contained on this website are provided on an "as-is" basis, are intended only to be informative, is not an advice nor a recommendation, nor research, or a record of our trading prices, or an offer of, or solicitation for a transaction in any financial instrument and thus should not be treated as such. The information provided does not involve any specific investment objectives, financial situation and needs of any specific person who may receive it. Please be aware, that past performance is not a reliable indicator of future performance and/or results. Past Performance or Forward-looking scenarios based upon the reasonable beliefs of the third-party provider are not a guarantee of future performance. Actual results may differ materially from those anticipated in forward-looking or past performance statements. IC Markets makes no representation or warranty and assumes no liability as to the accuracy or completeness of the information provided, nor any loss arising from any investment based on a recommendation, forecast or any information supplied by any third-party.
