Nzdcad buy analysisThis is how I analyse my chart.
And I'm waiting for that third touch so that I can go long with it
NZDCAD trade ideas

NZD/CAD Long positionMarket is creating HH and HL. The Market continues target the PDH array, and getting closer to FVG on Daily TF.
Look for buy opportunity only. Wait for pullback to enter, between 0.83922-0.83774.


NZD---Cad-----bullishthere are series of HH $ HL in trend there is no divergence in trend probability of high chances of trend continue

NZDCAD POTENTIAL LONG OPPORTUNITY Hello amazing people! Just wanted to come on here and make a post for the week on a potential upcoming opportunity I see on the NZDCAD currency cross. Potential bounce play if not new high play on the weekly coming into play so let's see what the market gives us but let's dive in!!
OK so when zooming out on the higher TF I saw that in 2022 NZDCAD made a huge run to the upside creating multi-year highs. Following this move we saw a long term corrective move coming in A LOT weaker and slower then that buyer push we saw. Something else I'm realizing on the weekly timeframe now is actually price forming subtle higher highs and higher lows on price on the weekly showing me a potential shift coming into play. This is what built my BIAS for a potential upside opportunity on this pair!
OK so when looking at the weekly and daily timeframe I was looking for some areas of demand to support this higher timeframe bias that I am formulating based on price action. When looking at the weekly and daily timeframes I found the 0.81700 demand zone as the strongest and highest confluence zone to see a bounce to the upside from! You can see the 78.6 (discount) fib level is aligning with the weekly/daily point of demand I have marked off as well on the charts.
Now I am waiting to watch how price comes into that level and if it can give me any more price action confluence to make this trade a little more juicy!
ALRIGHT GUYS! Hope you enjoyed!! Please boost this post and follow my page for more accurate analysis and trade setups! Love you all. God Bless!

NZDCAD - Bullish ReversalThe pair has made a bullish RSI divergence. We are selling it on printing higher high and higher low. The trade plan is set, let's hope for the profit!

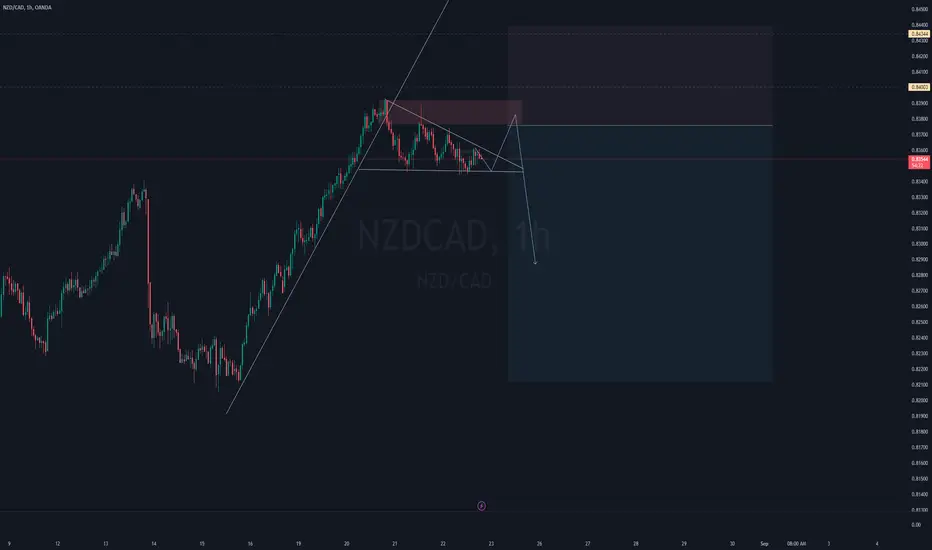
NZDCAD ShortWith prices reaching the value area , the three touch structure and ascending channel shows a potential reversal from the bears.

BUY NZDCAD - trade explained in detailTrader Tom, a technical analyst with over 15 years’ experience, explains his trade idea using price action and a top down approach. This is one of many trades so if you would like to see more then please follow us and hit the boost button.

NZDCAD Risky Short!NZD-CADshot up sharply
And the pair is locally
Oversold so after it
Hits the horizontal
Resistance of 0.83846
We will be expecting a
Local bearish correction !

NZD/CAD Short ideasBroke the trend line. Now in consolidation stage.
Target is the Equal Lows (Liquidity)
NZDCAD I am looking for shorts on the 1H I see a 1H bearish flag,just waiting for the candlestick conformation and NZDCAD is been on the uptrend for weeks

NZDCAD This MA squeeze giving a strong Buy Signal.The NZDCAD pair has been trading within a long-term Channel Up pattern, currently sitting above bot the 1D MA50 (blue trend-line) and the 1D MA200 (orange trend-line). The upcoming squeeze of the two MA periods was last time a confirmation that the Bullish Leg that started would continue.
That rally peaked on June 12, just above the 1.236 Fibonacci extension. As a result, even though we are practically half-way into the current rally and the potential return is now less, we turn bullish on this pair, targeting 0.85650.
-------------------------------------------------------------------------------
** Please LIKE 👍, FOLLOW ✅, SHARE 🙌 and COMMENT ✍ if you enjoy this idea! Also share your ideas and charts in the comments section below! This is best way to keep it relevant, support us, keep the content here free and allow the idea to reach as many people as possible. **
-------------------------------------------------------------------------------
💸💸💸💸💸💸
👇 👇 👇 👇 👇 👇

NZDCAD: Very Bullish Setup 🇳🇿🇨🇦
NZDCAD formed a cup and handle pattern
after a test of recently broken horizontal structure resistance.
I think that the price may bounce at least to 0.838 level.
❤️Please, support my work with like, thank you!❤️

Assumed channelHello friends.
According to the drawn channel, I expect a correction towards the midline range.
what is your opinion?
Good luck.
# Let's look simply

NZDCAD Downtrend Line Breakout At 0.83223 20.08.2024Apply risk management
Risk Warning: Trading in CFDs is highly speculative and carries a high level of risk. It is possible to lose all of your invested capital. These products may not be suitable for everyone, and you should ensure that you fully understand the risks taking into consideration your investment objectives, level of experience, personal circumstances as well as personal resources. Speculate only with funds that you can afford to lose. Seek independent advice if necessary. Please refer to our Risk Disclosure.
BDSwiss is a trading name of BDS Markets and BDS Ltd.
BDS Markets is a company incorporated under the laws of the Republic of Mauritius and is authorized and regulated by the Financial Services Commission of Mauritius ( FSC ) under license number C116016172, address: 6th Floor, Tower 1, Nexteracom Building 72201 Ebene.
BDS Ltd is authorized and regulated by the Financial Services Authority Seychelles (FSA) under license number SD047, address: Suite 3, Global Village, Jivan’s Complex, Mont Fleuri, Mahe, Seychelles. Payment transactions are managed by BDS Markets (Registration number: 143350)
Disclaimer

NZDCAD is nearing the end of its correction.I anticipate the NZDUSD pair will finish its correction between 0.8365 and 0.8374, after which I expect a bearish trend on H4.

NZDCAD Bullish ContinuationNZDCAD has turned bullish, currently forming an ascending triangle, a continuation pattern indicative of further upward momentum. The price has broken above the previous high, signaling strength in the trend. A buying opportunity may present itself upon a retest of the breakout level, where the previous resistance could act as new support. Traders should consider entering on confirmation of support, with stop-loss placement below the support level and targeting the next resistance or the measured move based on the pattern’s height.

NZDCAD - OverBought Territory... Hello TradingView Family / Fellow Traders. This is Richard, also known as theSignalyst.
📈 NZDCAD has been overall bullish , trading within the rising channel in blue.
Currently, NZDCAD is approaching the upper bound of the channel.
Moreover, the zone marked in red is a massive supply zone.
🏹 Thus, the highlighted red circle is a strong area to look for sell setups as it is the intersection of the supply zone and upper blue trendline acting as non-horizontal resistance.
📚 As per my trading style:
As #NZDCAD is around the red circle zone, I will be looking for bearish reversal setups (like a double top pattern, trendline break , and so on...)
📚 Always follow your trading plan regarding entry, risk management, and trade management.
Good luck!
All Strategies Are Good; If Managed Properly!
~Rich


NZDCAD: The bullish trend probably startedNZDCAD: The bullish trend probably started
The price rose by nearly 190 points from our previous analysis and reached our first target.
The pattern we were looking at is now taking a clearer shape.
The price is moving and preparing to rise for wave E of the pattern.
Speculation of a rate cut by the BOC could push the NZDCAD further.
You may find more details in the chart!
Thank you and Good Luck!
❤️PS: Please support with a like or comment if you find this analysis useful for your trading day❤️

Bearish Bias still INTACTI expect a swift bearish counter on Friday's possible retracement candle. The bearish bias on NZDCAD is still intact unless the bullish Friday candle upholds the bulls.
DISCLAIMER NOTICE!
This is only my opinion and not a financial advice to set up a trade or invest. Trading or investing without knowledge is highly risky.

nzdcadHello Traders here is my NZDCAD analysis where you can see there is a massive droping of price from 0.8240 - 0.82061 and is now creating an uptrend momentum towards previous highiest price ,. creating liquidity both sides and the price above has not yet mitigated., price below has been taken already. so the target now is the price above

NZDCAD Breakout And Potential RetraceHey Traders, in today's trading session we are monitoring NZDCAD for a selling opportunity around 0.83 zone, NZDCAD was trading in an uptrend and successfully managed to break it out. Currently is in a correction phase in which it is approaching the retrace area.
Trade safe, Joe.
