NZDCADWe were reacting to the support level and we are expecting an upswing... with a suitable risk to reward
NZDCAD trade ideas

Bulish NZDCAD is expectedNews in this week are very important, but technically the bullish pattern for NZD is more probable.

NZDCAD ShortThis currency has been forming a rising flag for the past few weeks and as for now, it is testing the support zone at 0.813.
Let us wait and see if it will break out of that trendline, retest the zone so that we can have a clear entry position.

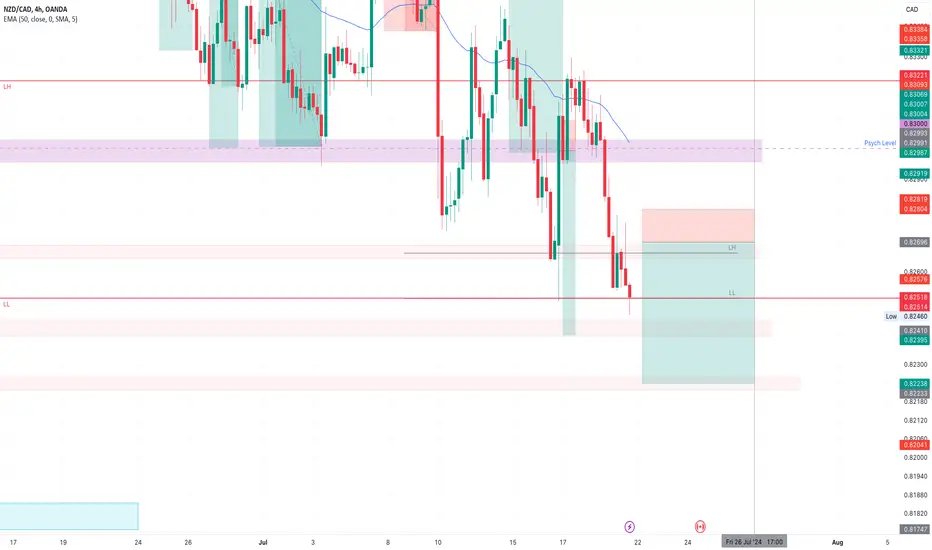
NZDCADLooking for a sell on NZDCAD this week just waiting for a strong sell signal to enter the trade.

NZDCAD Retracement Trade IdeaHi team, as we can see the overall trend is bearish, but we will expect a retracement first before a sweep of buyer liquidity in red level, remember to use money management yeah

NZDCAD: Classic Trend-Line Trade 🇳🇿🇨🇦
NZDCAD tested a major rising trend line on a daily.
After its test, the price formed a narrow range on an hourly time frame.
The resistance of the range was broken.
It is an important sign of strength of the buyers.
I bought the pair with 0.8156 target
❤️Please, support my work with like, thank you!❤️

NZDCAD - BUYNZDCAD is taking support from bullish trend line and RSI Divergence at Lower time frame.

nzdcad buy setuphi traders
this level of price is important
im watching priceaction to this level
if I see setup in low timeframe I will entry

NZD/ CAD !! 7/26 trendline Uptrend✍️ NOVA hello everyone, Let's comment on NZD/CAD price long-term trend
🔥 Identify:
D1 - long-term time frame shows that the price is following the Uptrend line - touching the trendline. wave 5
🔥 Technically:
Based on the resistance and support areas of the NZD/CAD price according to the H4 frame, NOVA identifies the important key areas as follows:
Resistance: 0.82500 - 0.84000 - 0.85500
🔥 NOTE:
Note: Nova wishes traders to manage their capital well
- take the number of lots that match your capital
- Takeprofit equal to 4-6% of capital account
- Stoplose equal to 2-3% of capital account
- The winner is the one who sticks with the market the longest

NZDCAD BearingBias Bearish
Fundamental Analysis
NZD is weakest performing currency.
CAD is also bearish but not as weak as NZD
Price Action:
Price broken H4 SR level then a small pullback and broken H1 SR level. 2 confirmation pattern that price is bearish. Trade based on breakout pattern. High volatility momentum
Set up:
Short trade entry at Broke H1 SR level.
TP 2x H1 ATR(20)
TP next lower SR level for daily tf R:R 1:4

NZDCAD WEEKLY SYMMETRICAL TRIANGLE, RETEST@78.6% 483 PIP MOVE?Trading the Symmetrical Triangle
Identify the Pattern: Recognize the symmetrical triangle on the price chart by connecting the series of lower highs and higher lows.
Wait for the Breakout: Do not enter a trade until the price breaks out of the triangle. A breakout is confirmed when the price closes outside the trend lines, either above the upper trend line or below the lower trend line.
Volume Confirmation: Look for an increase in volume during the breakout to confirm its validity.
Set Entry Points:
For an Upward Breakout: Enter a long position when the price breaks above the upper trend line.
For a Downward Breakout: Enter a short position when the price breaks below the lower trend line.
Set Stop-Loss Orders: Place stop-loss orders to manage risk. For an upward breakout, a stop-loss can be placed just below the lower trend line, and for a downward breakout, just above the upper trend line.
Set Profit Targets: Measure the height of the triangle (the vertical distance between the initial high and low) and project it from the breakout point to set profit targets.

NZDCAD broke strukture on weekly, swing trading I like to keep my trading analysis simple. I have been backtesting and trading this way for a while, and it has been working quite well. The key is to be patient and wait for the right opportunity. We had a bullish break of structure, so I will wait until it fills the lower weekly FVG to buy, with my target set at the psychological level of 0.87000.

Detailed Review of NZD/CAD Weekly Chart Analysis### Detailed Review of NZD/CAD Weekly Chart Analysis
#### Overview
The NZD/CAD currency pair has recently presented some intriguing patterns and formations on the weekly chart, suggesting a potential bullish outlook. Key indicators such as the SSL channel, bullish Fair Value Gaps (FVGs), and the sequence of swing lows (STLs) and intermediate trend lows (ITLs) are contributing to this analysis. Let's delve into each aspect to understand the implications and opportunities for traders.
#### SSL Channel Bullish Signal
The SSL (Semafor Stop Loss) channel is a critical tool used by traders to identify trend directions and potential reversals. In the case of NZD/CAD, the weekly chart shows a bullish signal where the SSL channel has been "grapped" or intersected. This intersection typically indicates a shift from a bearish to a bullish trend, signaling traders to look for long positions.
#### Creation of Bullish Fair Value Gap (FVG)
A Fair Value Gap (FVG) is a price gap where an imbalance between buyers and sellers has occurred, leading to a rapid price movement. On the NZD/CAD weekly chart, a bullish FVG has been created, highlighting an area where buyers have overwhelmed sellers. This gap often acts as a strong support zone, suggesting that the price may find a floor here before continuing its upward trajectory.
#### Sequence of Swing Lows (STLs) and Intermediate Trend Lows (ITLs)
1. **STL Formation:** The sequence of swing lows (STLs) is crucial for confirming trend reversals. In the case of NZD/CAD, the chart indicates the formation of new STLs, which further strengthens the bullish sentiment. These lows represent higher lows compared to previous swings, showing a consistent upward momentum.
2. **ITL Formation:** Intermediate Trend Lows (ITLs) are also forming in conjunction with STLs, providing additional validation for the bullish trend. ITLs are essential for identifying intermediate corrections within the primary trend, offering traders opportunities to enter the market during pullbacks.
3. **STL to be Created:** The pattern suggests that another STL is likely to be created soon. This anticipated formation aligns with the overall bullish sentiment, giving traders a potential entry point to capitalize on the upward movement.
#### Conclusion
The NZD/CAD weekly chart presents a compelling case for a bullish outlook based on several key indicators. The SSL channel's bullish signal, the creation of a bullish FVG, and the sequence of STLs and ITLs all point towards a strong upward trend. Traders should monitor these patterns closely and consider long positions to take advantage of the potential bullish movement.
By staying informed about these technical indicators and understanding their implications, traders can make more strategic decisions and maximize their trading opportunities in the NZD/CAD currency pair.

NZDCAD Will Go Up! Buy!
Please, check our technical outlook for NZDCAD.
Time Frame: 4h
Current Trend: Bullish
Sentiment: Oversold (based on 7-period RSI)
Forecast: Bullish
The market is approaching a significant support area 0.819.
The underlined horizontal cluster clearly indicates a highly probable bullish movement with target 0.825 level.
P.S
The term oversold refers to a condition where an asset has traded lower in price and has the potential for a price bounce.
Overbought refers to market scenarios where the instrument is traded considerably higher than its fair value. Overvaluation is caused by market sentiments when there is positive news.
Like and subscribe and comment my ideas if you enjoy them!

NZDCAD Simple Trade Plans (Technical/Fundamental)The latest mid-term downtrend has reflected an uptrend/upwards trajectory on a faster easing BOC Policy.
Lately, The RBNZ has reacted to data and given a more dovish stance, supplying NZD weakness and a return back down the up-trending channel.
CPI out of Canada today does not change this, NZD data later might.
Sentiment case still largely supports upside.

NZDCAD: Long Trade Explained
NZDCAD
- Classic bullish formation
- Our team expects pullback
SUGGESTED TRADE:
Swing Trade
Long NZDCAD
Entry - 0.8180
Sl - 0.8141
Tp - 0.8256
Our Risk - 1%
Start protection of your profits from lower levels
❤️ Please, support our work with like & comment! ❤️

NZDCAD SHORT Market Structure Bearish on HTFs
Entry at Daily AOi
Weekly Rejection at AOi
Daily Rejection at AOi
Weekly EMA retest
Previous Daily Structure Point
H4 Candlestick rejection at the AOi
Levels 4.24
Entry 75%
REMEMBER : Trading is a Game Of Probability
: Manage Your Risk
: Be Patient
: Every Moment Is Unique
: Rinse, Wash, Repeat!
: Stay Hydrated
#Follow#Share#Comment#Boost
NZD_CAD RISING SUPPORT AHEAD|LONG|
✅NZD_CAD is trading along the rising support
And as the pair will soon retest it
I am expecting the price to go up
To retest the supply levels above at 0.8200
LONG🚀
✅Like and subscribe to never miss a new idea!✅


NZDCAD Next Possible Move in Daily TF#NZDCAD Daily Forecast
wait for more confirmation LTF then we will enter for a trade

NZD/CAD Simple analysis and simple setupthe price is standing at a very critical area between 71 and 78 fib level. this will be great chance to buy this pair

NZD-CAD Long From Support! Buy!
Hello,Traders!
NZD-CAD went down
Sharply and the pair is
Locally oversold so as
It is already retesting the
Horizontal support of 0.8204
We will be expecting a local
Bullish correction
Buy!
Like, comment and subscribe to help us grow!
Check out other forecasts below too!

NZD/CAD - Short-term Bearish CampaignThe pair is on its way down towards the next big support key-level of 0.8211. The breakdown below the key level of 0.8350 a few days ago is the main trigger to this negative conviction.
