nzdcad will be bullish?hi traders
today im mentoring this pair for buying
the reasons for buy side is :fibo level and in daily significant resistance that break in previous movement
if I see any conformation in low time frame i will entry
NZDCAD trade ideas

NZDCAD Bullish IdeaThe pair has been going down for a long time and currently sitting 61.8 on fib level of a D1 chart and has Divergence on M30. I will expect the pair to do a correction and look for supply levels above


Weekly Outlook 21/07/24Weekly Outlook
DXY - EURUSD - EURAUD - NZDCAD
Swing structure Daily - 4H - 1H
Fibonacci
Premium Discount
Liquidity
Possible entry's

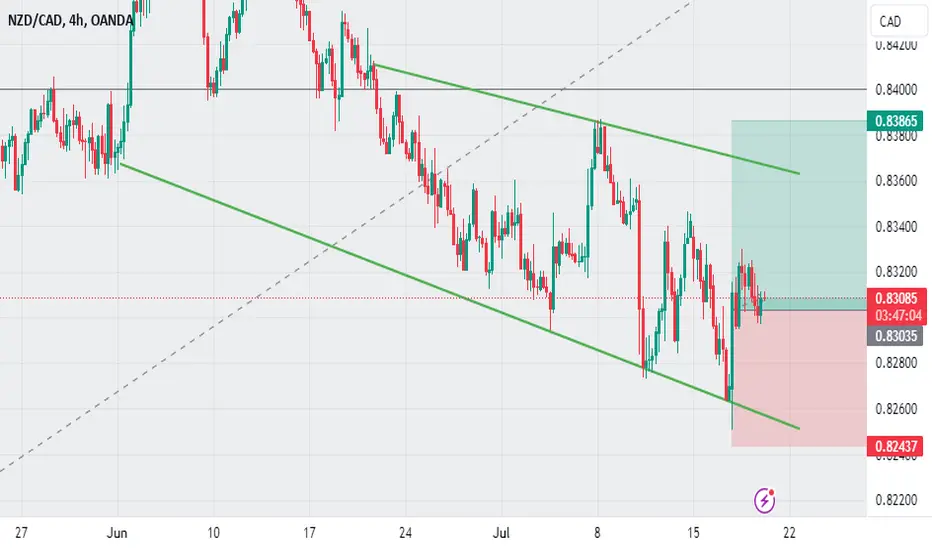
7 Dimension Sell Setup FOR NZDCADCORE Analysis Method: Smart Money Concepts
😇 7 Dimension Analysis
Time Frame: H4
1️⃣ Swing Structure: Bearish with BOS
Swing Move: Corrective move just reached at POI, making a deeper pullback for correction.
Internal Structure: Bearish, aligning with the larger timeframe.
POI: Momentum move in the low Premier zone.
Time Frame Confluence: H4, H1, M15, M5.
2️⃣ Pattern
🟢 CHART PATTERNS: Double top with false breakout.
🟢 CANDLE PATTERNS: Shrinking candles with long wicks forming a hammer. Narrow range patterns are just starting.
3️⃣ Volume:
Good volume observed in the move, but unable to breach this POI, indicating it might be just execution volume.
4️⃣ Momentum RSI:
🟢 In bearish momentum zone with range shift.
5️⃣ Volatility Bollinger Bands:
🟢 Contraction is just beginning, so the price might make a small range before moving further down.
6️⃣ Strength: NZD is weaker against CAD.
7️⃣ Sentiment: SELL.
✔️ Entry Time Frame: 15m
✅ Entry TF Structure: Bearish
✔ Entry Time POI: EXT ORDER BLOCK high probability
☑️ FIB Trigger: Activated
💡 Decision: SELL
🚀 Entry: 0.8337
✋ Stop loss: 0.8360
🎯 Take profit: 0.8156
😊 Risk to reward Ratio: 8 RR
🕛 Expected Duration: 20 days
SHORT SUMMARY
The analysis identifies a bearish swing structure on the H4 time frame, with a corrective move that has just reached the Point of Interest (POI), making a deeper pullback for correction. The internal structure is bearish, aligning with the larger timeframe. The POI is in the low Premier zone, with time frame confluence observed in H4, H1, M15, and M5.
A double top chart pattern with a false breakout is observed, along with shrinking candles forming a hammer. Narrow range patterns are just starting. Volume analysis indicates good volume in the move, but it is unable to breach the POI, suggesting it might be execution volume.
The Momentum RSI is in a bearish momentum zone with a range shift. Bollinger Bands indicate that contraction is just beginning, suggesting the price might form a small range before moving further down. NZD is weaker against CAD, supporting the bearish sentiment.
The decision is to sell at 0.8337, with a stop loss at 0.8360 and a take profit at 0.8156, providing an 8:1 risk to reward ratio. The expected duration for this trade setup is 20 days.

Some Of My Entry Reasons , How I Made +2000 Pips Per Week ?This Is An Educational + Analytic Content That Will Teach Why And How To Enter A Trade
Make Sure You Watch The Price Action Closely In Each Analysis As This Is A Very Important Part Of Our Method
Disclaimer : This Analysis Can Change At Anytime Without Notice And It Is Only For The Purpose Of Assisting Traders To Make Independent Investments Decisions.

NZDCAD Massive Long! BUY!
My dear friends,
Please, find my technical outlook for NZDCAD below:
The instrument tests an important psychological level 0.8260
Bias - Bullish
Technical Indicators: Supper Trend gives a precise Bullish signal, while Pivot Point HL predicts price changes and potential reversals in the market.
Target - 0.8294
About Used Indicators:
Super-trend indicator is more useful in trending markets where there are clear uptrends and downtrends in price.
———————————
WISH YOU ALL LUCK

Trade idea - NZDCAD Long4H
Corrective approach towards entry zone.
-68 Fibonacci completion aligning with entry zone.
= Buy limit.
0.75% risk.


NZDCAD Trade 0003 Bearish BiasHello Traders,
I am pleased to present trade number 0003 in my 1000 trade challenge. Today, we are focusing on the NZDCAD pair, which has been exhibiting a ranging behaviour for most of the day. However, a favourable entry signal has been identified.
Currently, the pair is trading around the 0.83000 level. The daily market structure indicates a bearish trend, which aligns with our trading strategy. It appears that the bullish momentum has weakened, creating a potential opportunity for us. My overall target for this trade is set at 0.81600, providing an attractive risk-to-reward ratio. In line with prudent risk management practices, I intend to secure partial profits at the 0.82500 mark to mitigate potential downside risks.
This trade has been assigned a moderate risk level, reflecting a balanced approach to capital preservation and profit generation. By doing so, we aim to capitalize on market movements while maintaining a disciplined trading strategy.
As always, I will be monitoring the trade closely and will provide updates as the situation evolves. The objective of this challenge is to refine our trading skills and enhance our understanding of market dynamics through practical application.
Best regards,
Renaldo Philander

NZDCAD goong up in style and slowTwo point of the chart indicating the first and second legs of entries on this pair and how to trade it for profits, so look for a sweetable entry and make money around 0.83000 upto 0.83870 for the first leg run and then from there look for a more upward move to 0.85190 as the second leg of the upward run...
🤝🏽

NZDCAdWhat are the odds that this pair will buy to those level. We join the market at the current market rate.

Bearish drop?NZD/CAD is rising towards the pivot which has been identified as an overlap resistance and could fall to the 1st support.
Pivot: 0.8348
1st Support: 0.82764
1st resistance: 0.83837
Risk Warning:
Trading Forex and CFDs carries a high level of risk to your capital and you should only trade with money you can afford to lose. Trading Forex and CFDs may not be suitable for all investors, so please ensure that you fully understand the risks involved and seek independent advice if necessary.
Disclaimer:
The above opinions given constitute general market commentary, and do not constitute the opinion or advice of IC Markets or any form of personal or investment advice.
Any opinions, news, research, analyses, prices, other information, or links to third-party sites contained on this website are provided on an "as-is" basis, are intended only to be informative, is not an advice nor a recommendation, nor research, or a record of our trading prices, or an offer of, or solicitation for a transaction in any financial instrument and thus should not be treated as such. The information provided does not involve any specific investment objectives, financial situation and needs of any specific person who may receive it. Please be aware, that past performance is not a reliable indicator of future performance and/or results. Past Performance or Forward-looking scenarios based upon the reasonable beliefs of the third-party provider are not a guarantee of future performance. Actual results may differ materially from those anticipated in forward-looking or past performance statements. IC Markets makes no representation or warranty and assumes no liability as to the accuracy or completeness of the information provided, nor any loss arising from any investment based on a recommendation, forecast or any information supplied by any third-party.

NZDCAD Set To Grow! BUY!
My dear subscribers,
NZDCAD looks like it will make a good move, and here are the details:
The market is trading on 0.8290 pivot level.
Bias - Bullish
Technical Indicators: Both Super Trend & Pivot HL indicate a highly probable Bullish continuation.
Target - 0.8304
About Used Indicators:
The average true range (ATR) plays an important role in 'Supertrend' as the indicator uses ATR to calculate its value. The ATR indicator signals the degree of price volatility.
———————————
WISH YOU ALL LUCK

#NZDCAD#NZDCAD
This may just be the next beauty coming up, expecting some bullish move on this pair, will get more confirmation after the break of the resistance level at $0.83832
#forex #forextrading #forexsignals #crypto #forexlifestyle #money #lifestyle #trade #stock #cash #iphone #daytrading #currencytrading #tradingonline #swingtrading #profit #forextips
