NZDCAD SHORT Market Structure bearish on HTFs DW
Entry at both Daily and Weekly AOi
Weekly Rejection At AOi
Weekly EMA retest
Daily Rejection at AOi
Previous Daily Structure point
Around Psychological Level 0.82500
H4 Candlestick rejection
Levels 5.31
Entry 90%
REMEMBER : Trading is a Game Of Probability
: Manage Your Risk
: Be Patient
: Every Moment Is Unique
: Rinse, Wash, Repeat!
: Christ is King.
NZDCAD trade ideas

NZDCAD Elliot Waves forecast: Is wave 1 complete?NZDCAD have completed wave 2 which have unfolded as a complex correction WXY. Looks like currently price is making wave 1 of lower degree. If this count is correct we should expect price to retrace to the golden zone fib 50% to 61.8% before resuming the bullish momentum. Lets continue to monitor it a possible short setup when the 1st wave is completed.

NZDCAD: Bearish Continuation is Highly Probable! Here is Why:
The price of NZDCAD will most likely collapse soon enough, due to the supply beginning to exceed demand which we can see by looking at the chart of the pair.
❤️ Please, support our work with like & comment! ❤️

NZD/CAD For Bullishwait for pull-back near by entry point and then go long
general trend is up trend
have fun :)

Institutional Supply: NZD/CAD shortsHey,
Next on my list is NZD/CAD.
Like many other pairs, it’s in an extreme move — with our zones acting like magnets where price may finally pause and take a breath.
In these conditions, it’s all about patience. Whether you’re riding strong trends or waiting for a reversal, let the market do its thing.
And as always, be careful trying to catch falling knives.
Kind regards,
Max Nieveld

NZD/CAD Chart Analysis (30m TF) Market Outlook: BearishNZD/CAD Chart Analysis (30m TF)
Market Outlook: Bearish
Entry Point:
Sell at 0.82192 (current price zone marked with horizontal line and price tag)
Take Profit Targets:
TP1: 0.81483 (first horizontal support line)
Final TP: 0.80768 (second and lower support zone)
Support Levels:
0.81483 — Minor support (first target)
0.80768 — Strong support (final target area)
Resistance Level:
0.82192 — Immediate resistance (entry point zone)
Minor intraday resistance near 0.82350 (local highs)
Technical Observation:
Price formed a lower high and is consolidating below resistance.
Bearish breakout setup drawn with projection to the downside.
Confirmation to sell upon clear breakdown below support area and continuation pattern forming.

CadnzdAm still pretty much interested in this trade if price much up back to the support and break and retest then we look for a buy position

NZDCADwe are the bottom of the chanel. i expect price to go UP to uper band of chanel. wait for trend line brake.

Watching Volume Clusters for Short Opportunities on NZD/CADThe OANDA:NZDCAD pair is respecting a clear bearish market structure on the weekly timeframe. Price remains below the Ichimoku cloud (Span A at 0.8081 and Span B at 0.8218), confirming ongoing bearish momentum.
Price is now hovering around the Point of Control (POC) from the volume profile of the last major move — between 0.822 and 0.815, an area of high transaction activity and potential resistance. This zone presents a valid area to initiate short positions, especially given the lack of bullish breakout.
However, the optimal supply zone lies slightly higher between 0.823 and 0.838, which also corresponds to the second-highest volume node in the current range. If price pushes into this area and shows rejection, it may offer a cleaner entry for higher reward setups.
The target for this bearish scenario is the previous swing low at 0.7687, which marks a significant support level. The invalidating level for the bearish bias is a break above 0.8480, which sits above the recent structural high.
Trade Setup Summary:
Short Entry Zone 1 (aggressive): 0.822 – 0.815 (POC area)
Short Entry Zone 2 (optimal): 0.823 – 0.838 (supply zone)
Stop Loss: Above 0.8480
Target: 0.7687
The TSI indicators are near neutral but slightly negative:
TSI(10): -0.13
TSI(20): -0.04
This confirms the bearish pressure remains, but the move is not oversold, leaving room for further downside continuation.
The New Zealand dollar remains under pressure due to softening economic data and expectations of dovish monetary policy from the RBNZ, while the Canadian dollar has recently found support from stronger oil prices and relatively stable BoC guidance. Although both currencies are commodity-linked, CAD's correlation with energy gives it an edge in current conditions. As long as this divergence holds, the bias on NZD/CAD remains to the downside, in line with the current technical structure.
Disclaimer: This content is for educational and informational purposes only. It does not represent financial advice or a recommendation to buy or sell any financial instrument. Trading involves risk, and you should only trade with money you can afford to lose.

NZDCAD: Bearish Continuation & Short Signal
NZDCAD
- Classic bearish formation
- Our team expects fall
SUGGESTED TRADE:
Swing Trade
Sell NZDCAD
Entry Level - 0.8262
Sl - 0.8332
Tp - 0.8116
Our Risk - 1%
Start protection of your profits from lower levels
Disclosure: I am part of Trade Nation's Influencer program and receive a monthly fee for using their TradingView charts in my analysis.
❤️Please, support our work with like & comment!❤️

NZDCAD Is Going Up! Buy!
Take a look at our analysis for NZDCAD.
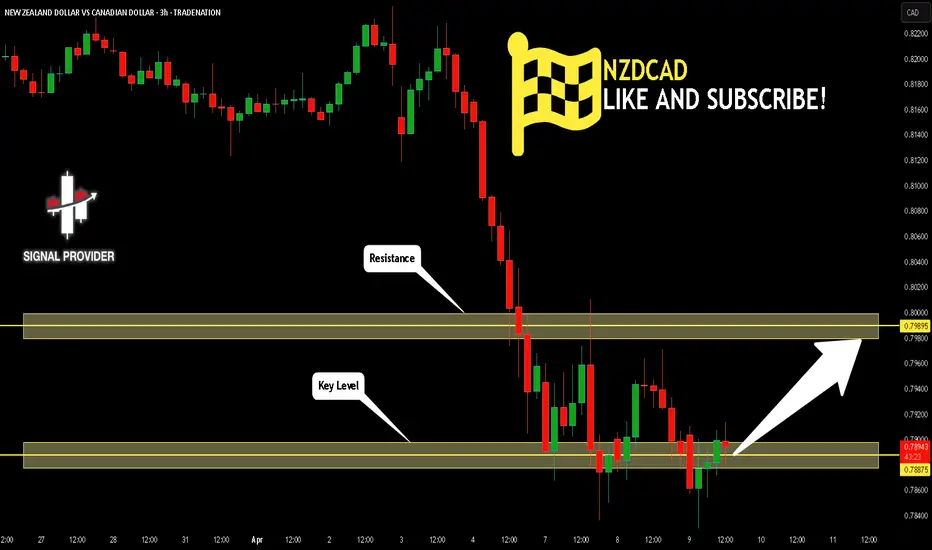
Time Frame: 3h
Current Trend: Bullish
Sentiment: Oversold (based on 7-period RSI)
Forecast: Bullish
The market is on a crucial zone of demand 0.788.
The oversold market condition in a combination with key structure gives us a relatively strong bullish signal with goal 0.798 level.
P.S
Please, note that an oversold/overbought condition can last for a long time, and therefore being oversold/overbought doesn't mean a price rally will come soon, or at all.
Disclosure: I am part of Trade Nation's Influencer program and receive a monthly fee for using their TradingView charts in my analysis.
Like and subscribe and comment my ideas if you enjoy them!
NZD/CAD SENDS CLEAR BEARISH SIGNALS|SHORT
NZD/CAD SIGNAL
Trade Direction: short
Entry Level: 0.826
Target Level: 0.804
Stop Loss: 0.840
RISK PROFILE
Risk level: medium
Suggested risk: 1%
Timeframe: 9h
Disclosure: I am part of Trade Nation's Influencer program and receive a monthly fee for using their TradingView charts in my analysis.
✅LIKE AND COMMENT MY IDEAS✅

NZDCAD SELLSell Bias Over All on NZDCAD, Looking for Price to get up to the Zone Before a Massive Sell Off to the Downside.

NZDCAD Will Go Up! Long!
Please, check our technical outlook for NZDCAD.
Time Frame: 1D
Current Trend: Bullish
Sentiment: Oversold (based on 7-period RSI)
Forecast: Bullish
The price is testing a key support 0.825.
Current market trend & oversold RSI makes me think that buyers will push the price. I will anticipate a bullish movement at least to 0.847 level.
P.S
Overbought describes a period of time where there has been a significant and consistent upward move in price over a period of time without much pullback.
Disclosure: I am part of Trade Nation's Influencer program and receive a monthly fee for using their TradingView charts in my analysis.
Like and subscribe and comment my ideas if you enjoy them!

NZDCAD: Short Trading Opportunity
NZDCAD
- Classic bearish setup
- Our team expects bearish continuation
SUGGESTED TRADE:
Swing Trade
Short NZDCAD
Entry Point - 0.8240
Stop Loss - 0.8326
Take Profit - 0.8088
Our Risk - 1%
Start protection of your profits from lower levels
Disclosure: I am part of Trade Nation's Influencer program and receive a monthly fee for using their TradingView charts in my analysis.
❤️ Please, support our work with like & comment! ❤️

Bearish Forecast on NZDCAD NZDCAD New Forecast👨💻👨💻
This is my personal trade and not in anyway a mandatory setup.
Note:
Follow proper risk management rules. Never risk more then 2% of your total capital. Money management is the key of success in this business...... Set your own SL & TP.
Please support this idea with a Like and COMMENT if you find it useful click "follow" on our profile if you will like these type of trading ideas delivered straight to your email in the future.
Thanks for your continued support!! lemme know your thoughts in the comment sec..

NZD/CAD Fundamental updateNZD/CAD – Potential Short Setup (M30 Timeframe)
The NZD/CAD pair on the M30 timeframe is showing signs of a potential selling opportunity following the recent formation of a breakout pattern, indicating a possible shift in momentum to the downside over the next few hours.
Possible Short Trade:
Entry: Watch for a short entry near the trendline of the breakout pattern.
Target Levels:
1st Support: 0.8138
2nd Support: 0.8077
This setup aligns with a breakout-retest scenario. Wait for confirmation before entering.
---
Please hit the like button and leave a comment to support my post!
Your likes and feedback are incredibly motivating and inspire me to share more quality analysis with you.
Best Regards,
JAMES_GOLD_MASTER_MQL5
Thank you!

NZDCAD Discretionary Analysis: Bank Manipulation?The price just crashed into the distribution block, straight into that sellside liquidity order block like it knew exactly where it was going. Bank manipulation? It's all over this one. The institutional orderflow is running the show, and with a sharp liquidity spike followed by orders stacking up like a ticking time bomb, it's getting real... they are manipulating the price. The fair value gap is wide, and that uptrust into the distribution channel? That's the red flag that’s flashing "this is it." Everything is lined up for a big move, and I'm here for going on the lower timeframe and entering on that liquidity sweep from a NY Open manipulated candlestick.
Just kidding, I just think it's gonna go up.

NZD/CAD Fundamental Update (17.04.2025) The NZD/CAD Pair on the M30 timeframe presents a Potential Selling Opportunity due to a recent Formation of a Breakout Pattern. This suggests a shift in momentum towards the downside in the coming hours.
Possible Short Trade:
Entry: Consider Entering A Short Position around Trendline Of The Pattern.
Target Levels:
1st Support – 0.8138
2nd Support – 0.8077
🎁 Please hit the like button and
🎁 Leave a comment to support for My Post !
Your likes and comments are incredibly motivating and will encourage me to share more analysis with you.
Best Regards, KABHI_TA_TRADING
Thank you.

Bearish drop?NZD/CAD is reacting off the pivot and could drop to the 1st support.
Pivot: 0.82329
1st Support: 0.82448
1st Resistance: 0.83294
Risk Warning:
Trading Forex and CFDs carries a high level of risk to your capital and you should only trade with money you can afford to lose. Trading Forex and CFDs may not be suitable for all investors, so please ensure that you fully understand the risks involved and seek independent advice if necessary.
Disclaimer:
The above opinions given constitute general market commentary, and do not constitute the opinion or advice of IC Markets or any form of personal or investment advice.
Any opinions, news, research, analyses, prices, other information, or links to third-party sites contained on this website are provided on an "as-is" basis, are intended only to be informative, is not an advice nor a recommendation, nor research, or a record of our trading prices, or an offer of, or solicitation for a transaction in any financial instrument and thus should not be treated as such. The information provided does not involve any specific investment objectives, financial situation and needs of any specific person who may receive it. Please be aware, that past performance is not a reliable indicator of future performance and/or results. Past Performance or Forward-looking scenarios based upon the reasonable beliefs of the third-party provider are not a guarantee of future performance. Actual results may differ materially from those anticipated in forward-looking or past performance statements. IC Markets makes no representation or warranty and assumes no liability as to the accuracy or completeness of the information provided, nor any loss arising from any investment based on a recommendation, forecast or any information supplied by any third-party.

#NZDCAD: Great Time To Swing Sell! Comment Your View! NZDCAD is at a critical selling level, and we expect a significant drop. The chart shows potential price reversals, either continuing in our direction or rising to the red circle before reversing. A risk-managed trade could benefit from this.
Good luck and trade safely!
Much Love ❤️
Team Setupsfx_

NZDCAD Trading Opportunity! SELL!
My dear friends,
Please, find my technical outlook for NZDCAD below:
The price is coiling around a solid key level - 0.8223
Bias - Bearish
Technical Indicators: Pivot Points Low anticipates a potential price reversal.
Super trend shows a clear sell, giving a perfect indicators' convergence.
Goal - 0.8103
About Used Indicators:
The pivot point itself is simply the average of the high, low and closing prices from the previous trading day.
Disclosure: I am part of Trade Nation's Influencer program and receive a monthly fee for using their TradingView charts in my analysis.
———————————
WISH YOU ALL LUCK

NZD CAD #0010 Short Swing Trading - The trade relies on the liquidity pools around the structures.
- The Main drive for the Sell limit Order placement was the Monthly CHoCH that occurred as labeled in the diagram.
- It is supported by the nearest Break of Structure on the Monthly level, giving the impression that the Trade is on continuation, however, Correction is inevitable.
- We have decided that the Liqidity Pools exist within the Orderblock to give the highest liquidity.
- Our trade is to capture the correction price within the order blocks and ride on the continuation of the Downtrend.
- The nature of this entry is Swing Trading, where holding days are between 3 days to 10 days.
