NZD-CHF Broken Wedge Pattern! Buy!
Hello,Traders!
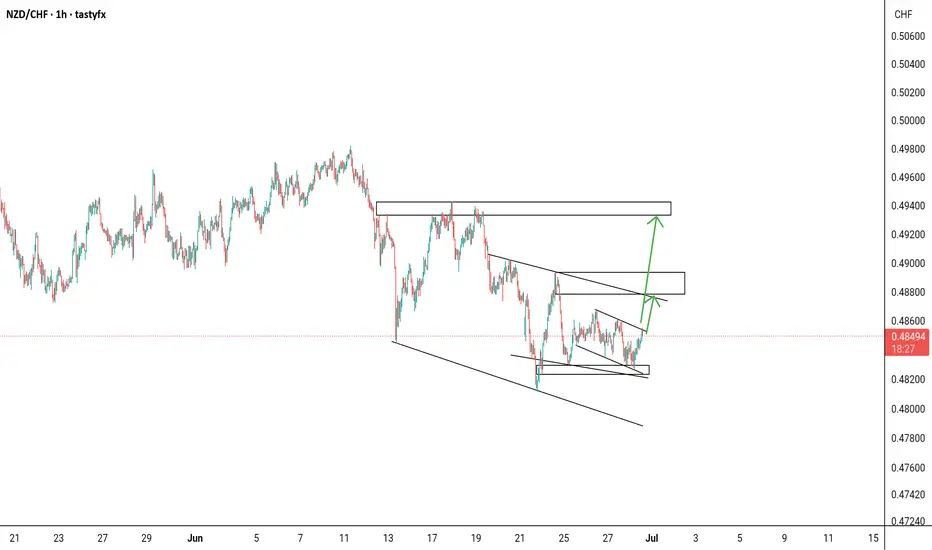
NZD-CHF was trading in a
Narrowing bullish wedge pattern
And now we are finally seeing
A bullish breakout so we are
Bullish biased now and we
Will be expecting a further
Bullish move up after a
Local correction
Buy!
Comment and subscribe to help us grow!
Check out other forecasts below too!
Disclosure: I am part of Trade Nation's Influencer program and receive a monthly fee for using their TradingView charts in my analysis.
NZDCHF trade ideas

NZD/CHF BEARS ARE STRONG HERE|SHORT
Hello, Friends!
NZD/CHF is trending down which is clear from the red colour of the previous weekly candle. However, the price has locally surged into the overbought territory. Which can be told from its proximity to the BB upper band. Which presents a classical trend following opportunity for a short trade from the resistance line above towards the demand level of 0.475.
Disclosure: I am part of Trade Nation's Influencer program and receive a monthly fee for using their TradingView charts in my analysis.
✅LIKE AND COMMENT MY IDEAS✅

NZD_CHF RISKY LONG|
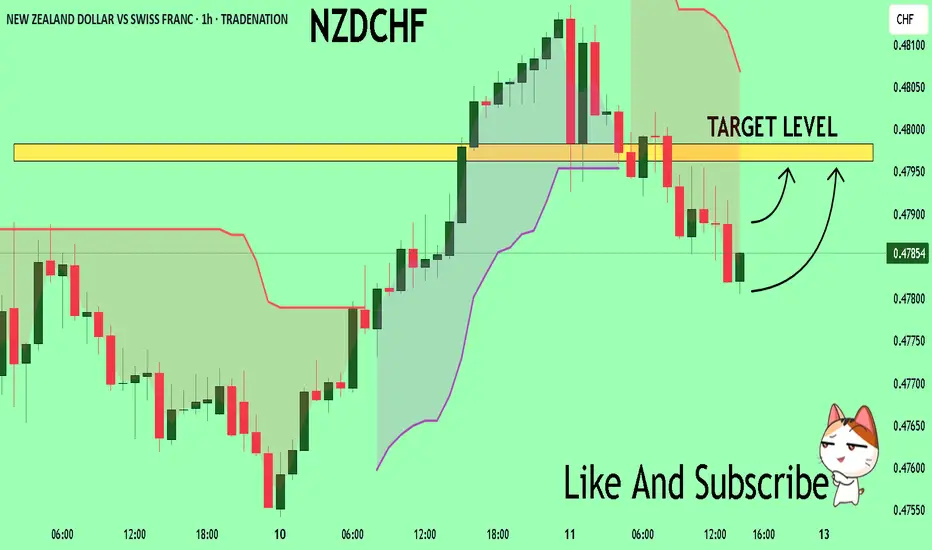
✅NZD_CHF has retested a key support level of 0.4760
And as the pair is already making a bullish rebound
A move up to retest the supply level above at 0.4776 is likely
LONG🚀
✅Like and subscribe to never miss a new idea!✅
Disclosure: I am part of Trade Nation's Influencer program and receive a monthly fee for using their TradingView charts in my analysis.


NZDCHF Long Trade based on COT ReportOANDA:NZDCHF Long trade, with my back testing of this strategy, it hits multiple possible take profits, manage your position accordingly.
This is good trade, don't overload your risk like greedy, be disciplined trader, this is good trade.
Use proper risk management
Looks like good trade.
Lets monitor.
Use proper risk management.
Disclaimer: only idea, not advice

NZDCHF Bullish Breakout!
HI,Traders !
#NZDCHF has formed a bullish
Wedge pattern and now we are
Seeing a bullish breakout which
Is confirmed so we are bullish
Biased and we will be expecting
A further bullish move up !
Comment and subscribe to help us grow !

NZDCHF My Opinion! BUY!
My dear friends,
Please, find my technical outlook for NZDCHF below:
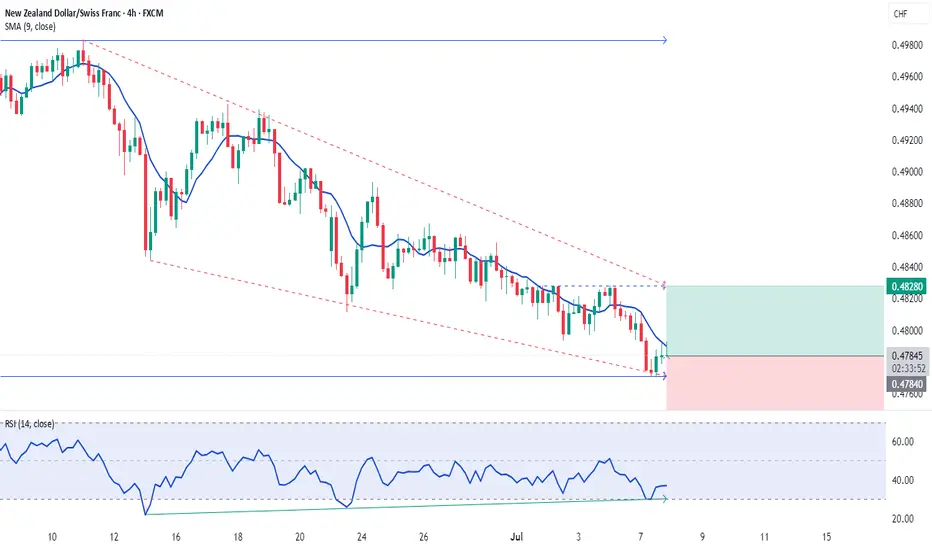
The instrument tests an important psychological level 0.4784
Bias - Bullish
Technical Indicators: Supper Trend gives a precise Bullish signal, while Pivot Point HL predicts price changes and potential reversals in the market.
Target - 0.4796
About Used Indicators:
Super-trend indicator is more useful in trending markets where there are clear uptrends and downtrends in price.
Disclosure: I am part of Trade Nation's Influencer program and receive a monthly fee for using their TradingView charts in my analysis.
———————————
WISH YOU ALL LUCK
NZDCHF - Bearish Triple TOPHello Traders !
The NZDCHF price formed a triple top pattern.
Currently, The neckline is broken!
So, I expect a bearish move📉
________________
TARGET: 0.47280🎯

NZD_CHF BEARISH BREAKOUT|SHORT|
✅NZD_CHF keeps falling in
A strong downtrend and the pair
Made a bearish breakout and a
Retest of the key horizontal level
Of 0.4810 which is now a resistance
And the pair is already making a
Bearish pullback so we are
Bearish biased and we will be
Expecting a further bearish move down
SHORT🔥
✅Like and subscribe to never miss a new idea!✅
Disclosure: I am part of Trade Nation's Influencer program and receive a monthly fee for using their TradingView charts in my analysis.


NZDCHF REVERSALTechnically:
NZDCHF Printed bullish divergence
NZDCHF broke it's last lower high
NZDCHF broke bearish trend line which acted as support
NZDCHF retested bearish trend line which now acted as resistance
NZDCHF after printing first higher high retrace fib 0.812.

NZDCHF SELL.......📉 NZD/CHF Trade Idea – Bearish Setup (Daily Chart)
Price is respecting a strong downtrend, forming lower highs and lower lows. Currently approaching a key resistance zone near 0.4850–0.4875, aligned with the descending trendline and 50–61.8% Fibonacci retracement.
🔹 Trade Plan:
Bias: Bearish
Entry Zone: 0.4850–0.4875
Stop Loss: Above 0.4935
Take Profit 1: 0.4700
Take Profit 2: 0.4635
This setup offers a solid risk-to-reward ratio, with confirmation expected on bearish rejection at the pullback zone.

NZDCHF: Will Keep Falling! Here is Why:
It is essential that we apply multitimeframe technical analysis and there is no better example of why that is the case than the current NZDCHF chart which, if analyzed properly, clearly points in the downward direction.
Disclosure: I am part of Trade Nation's Influencer program and receive a monthly fee for using their TradingView charts in my analysis.
❤️ Please, support our work with like & comment! ❤️


NZDCHF SELL OPPORTUNITY Price dropped lower and currently trade at 0.48028 a sell opportunity is envisaged from the current market price. Technically, the trend has been bearish from the H4 perspective. It’s a good sign that we may see further declines in price.

NZDCHF – Waiting for a Reaction at Key LevelWe’re waiting for price to reach our marked zone.
✅ Short is the primary scenario — but only with a valid bearish signal.
❗️If the zone breaks and price confirms above, we’ll look to buy after a proper pullback and signal.
We don’t predict — we prepare.
The market decides, we just follow with structure and discipline.

NZDCHF LONG BUY TRADE After some hesitation and heavy manipulation, NZDCHF looks bullish and is a good trade to enter provided SNB doesn't intervene with manipulations.
NZD/CHF Heist Blueprint: Snag the Kiwi vs. Franc Profits!Ultimate NZD/CHF Heist Plan: Snag the Kiwi vs. Franc Loot! 🚀💰
🌍 Greetings, Wealth Raiders! Hola! Ciao! Bonjour! 🌟
Fellow money chasers and market bandits, 🤑💸 let’s dive into the NZD/CHF "Kiwi vs. Franc" Forex heist with our 🔥Thief Trading Style🔥, blending sharp technicals and solid fundamentals. Follow the charted strategy for a long entry, aiming to cash out near the high-risk ATR zone. Watch out for overbought signals, consolidation, or a trend reversal trap where bearish robbers lurk. 🏴☠️💪 Seize your profits and treat yourself—you’ve earned it! 🎉
Entry 📈
The vault’s open wide! 🏦 Grab the bullish loot at the current price—the heist is live! For precision, set Buy Limit orders on a 15 or 30-minute timeframe, targeting a retest of the nearest high or low.
Stop Loss 🛑
📍 Place your Thief SL at the recent swing low on a 4H timeframe for day trades.
📍 Adjust SL based on your risk tolerance, lot size, and number of orders.
Target 🎯
Aim for 0.50400 or slip out early to secure your loot! 💰
Scalpers, Listen Up! 👀
Stick to long-side scalps. Got big capital? Jump in now! Smaller stacks? Join swing traders for the robbery. Use a trailing SL to lock in your gains. 🧲💵
NZD/CHF Market Intel 📊
The Kiwi vs. Franc is riding a bullish wave, fueled by key drivers. Dig into the fundamentals, macro trends, COT reports, sentiment, intermarket analysis, and future targets for the full scoop. 🔗👇
⚠️ Trading Alert: News & Position Safety 📰
News drops can shake the market! To protect your loot:
Skip new trades during news releases.
Use trailing stops to secure profits and limit losses. 🚫
Join the Heist! 💥
Support our robbery plan—hit the Boost Button! 🚀 Let’s stack cash with ease using the Thief Trading Style. 💪🤝 Stay sharp for the next heist plan, bandits! 🤑🐱👤🎉

long nzdchfif 4hr candle closes as bullish in the next 20mins. buy nzdchf with TIGHT STOP. use today's low as your sl

NZD/CHFPrice action trading is a methodology in financial markets where traders make decisions based on the actual price movements of an asset over time, rather than relying heavily on technical indicators or fundamental analysis. It involves observing and interpreting patterns and trends in price charts to predict future price movements.

NZDCHF Is Very Bullish! Buy!
Take a look at our analysis for NZDCF
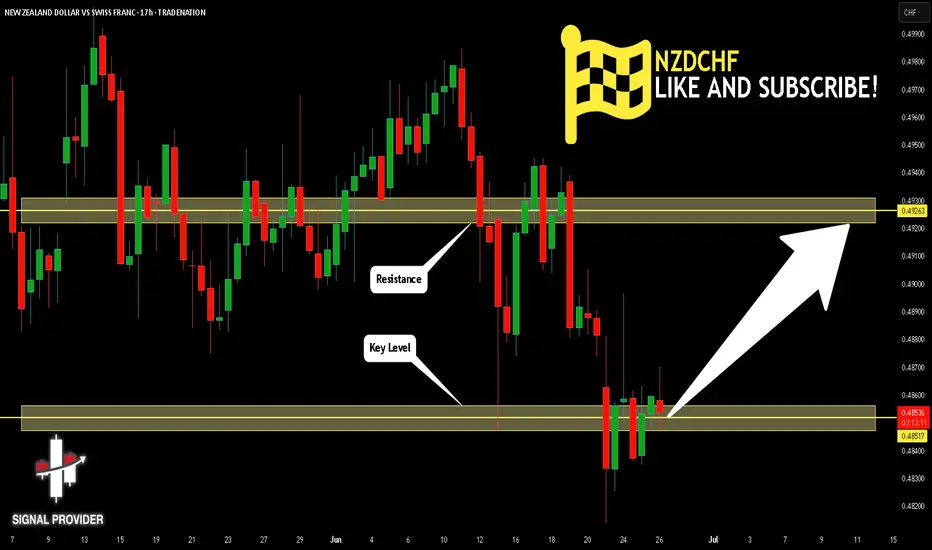
Time Frame: 17h
Current Trend: Bullish
Sentiment: Oversold (based on 7-period RSI)
Forecast: Bullish
The market is testing a major horizontal structure 0.485.
Taking into consideration the structure & trend analysis, I believe that the market will reach 0.492 level soon.
P.S
The term oversold refers to a condition where an asset has traded lower in price and has the potential for a price bounce.
Overbought refers to market scenarios where the instrument is traded considerably higher than its fair value. Overvaluation is caused by market sentiments when there is positive news.
Disclosure: I am part of Trade Nation's Influencer program and receive a monthly fee for using their TradingView charts in my analysis.
Like and subscribe and comment my ideas if you enjoy them!
NZD/CHF Potential Bullish Reversal SetupNZD/CHF Potential Bullish Reversal Setup 🔄📈
📊 Chart Analysis:
The chart shows a potential bullish reversal for NZD/CHF, supported by technical patterns and key levels:
🧠 Key Technical Highlights:
🔹 Double Bottom Formation (🟠 Circles)
A clear double bottom pattern can be seen around the 0.48300 support zone, signaling potential reversal from the downtrend.
🔹 Strong Support Zone 📉
Price bounced from a historically respected support zone (~0.48200–0.48400), which held several times in the past (marked with green arrows).
🔹 Downtrend Breakout 🔺
A short-term bearish channel has been broken to the upside, indicating potential bullish pressure.
🔹 Target Zone 🎯
Immediate bullish target is around 0.49265, aligning with previous resistance.
🔹 Resistance Area (🔵 Boxes)
Next significant resistance lies at 0.49400–0.49800, which may act as the next hurdle if price breaks the 0.49265 level.
✅ Conclusion:
As long as price holds above 0.48400, bulls may aim for the 0.49265 🎯 target. A breakout above that level can open the path to higher resistances.
📌 Bullish Bias maintained above support zone — monitor for volume confirmation and retest strength.
