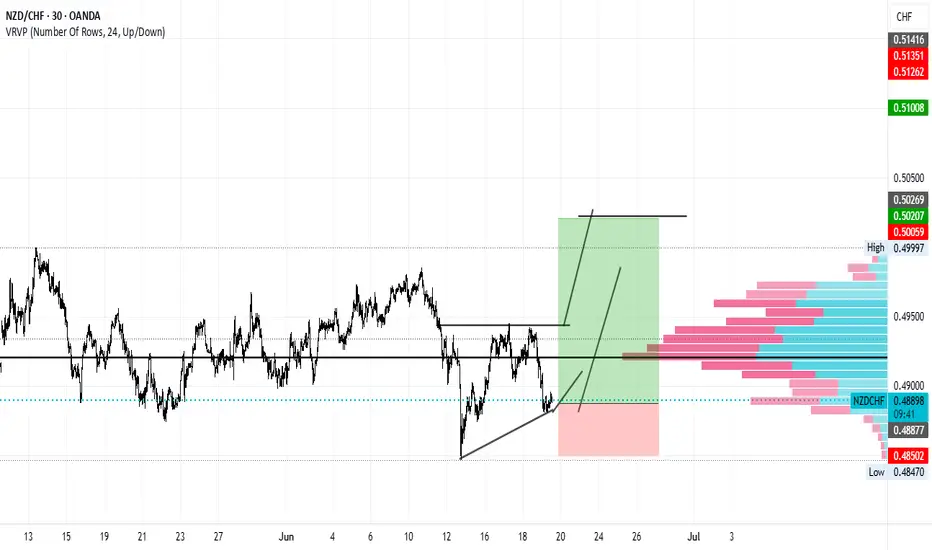
NZDCHF Bullish Breakout!
HI,Traders !
#NZDCHF has formed a bullish
Wedge pattern and now we are
Seeing a bullish breakout which
Is confirmed so we are bullish
Biased and we will be expecting
A further bullish move up !
Comment and subscribe to help us grow !
NZDCHF trade ideas

NZDCHF: Will Keep Falling! Here is Why:
It is essential that we apply multitimeframe technical analysis and there is no better example of why that is the case than the current NZDCHF chart which, if analyzed properly, clearly points in the downward direction.
Disclosure: I am part of Trade Nation's Influencer program and receive a monthly fee for using their TradingView charts in my analysis.
❤️ Please, support our work with like & comment! ❤️

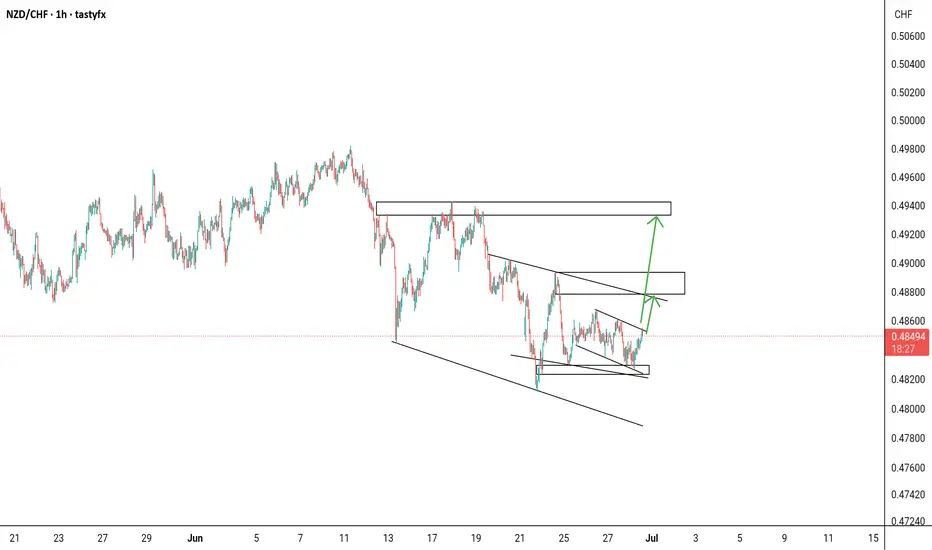
NZD_CHF BEARISH BREAKOUT|SHORT|
✅NZD_CHF keeps falling in
A strong downtrend and the pair
Made a bearish breakout and a
Retest of the key horizontal level
Of 0.4810 which is now a resistance
And the pair is already making a
Bearish pullback so we are
Bearish biased and we will be
Expecting a further bearish move down
SHORT🔥
✅Like and subscribe to never miss a new idea!✅
Disclosure: I am part of Trade Nation's Influencer program and receive a monthly fee for using their TradingView charts in my analysis.

NZDCHF - Bearish Triple TOPHello Traders !
The NZDCHF price formed a triple top pattern.
Currently, The neckline is broken!
So, I expect a bearish move📉
________________
TARGET: 0.47280🎯


NZDCHF SELL OPPORTUNITY Price dropped lower and currently trade at 0.48028 a sell opportunity is envisaged from the current market price. Technically, the trend has been bearish from the H4 perspective. It’s a good sign that we may see further declines in price.

NZDCHF – Waiting for a Reaction at Key LevelWe’re waiting for price to reach our marked zone.
✅ Short is the primary scenario — but only with a valid bearish signal.
❗️If the zone breaks and price confirms above, we’ll look to buy after a proper pullback and signal.
We don’t predict — we prepare.
The market decides, we just follow with structure and discipline.

NZDCHF LONG BUY TRADE After some hesitation and heavy manipulation, NZDCHF looks bullish and is a good trade to enter provided SNB doesn't intervene with manipulations.
NZD/CHF Heist Blueprint: Snag the Kiwi vs. Franc Profits!Ultimate NZD/CHF Heist Plan: Snag the Kiwi vs. Franc Loot! 🚀💰
🌍 Greetings, Wealth Raiders! Hola! Ciao! Bonjour! 🌟
Fellow money chasers and market bandits, 🤑💸 let’s dive into the NZD/CHF "Kiwi vs. Franc" Forex heist with our 🔥Thief Trading Style🔥, blending sharp technicals and solid fundamentals. Follow the charted strategy for a long entry, aiming to cash out near the high-risk ATR zone. Watch out for overbought signals, consolidation, or a trend reversal trap where bearish robbers lurk. 🏴☠️💪 Seize your profits and treat yourself—you’ve earned it! 🎉
Entry 📈
The vault’s open wide! 🏦 Grab the bullish loot at the current price—the heist is live! For precision, set Buy Limit orders on a 15 or 30-minute timeframe, targeting a retest of the nearest high or low.
Stop Loss 🛑
📍 Place your Thief SL at the recent swing low on a 4H timeframe for day trades.
📍 Adjust SL based on your risk tolerance, lot size, and number of orders.
Target 🎯
Aim for 0.50400 or slip out early to secure your loot! 💰
Scalpers, Listen Up! 👀
Stick to long-side scalps. Got big capital? Jump in now! Smaller stacks? Join swing traders for the robbery. Use a trailing SL to lock in your gains. 🧲💵
NZD/CHF Market Intel 📊
The Kiwi vs. Franc is riding a bullish wave, fueled by key drivers. Dig into the fundamentals, macro trends, COT reports, sentiment, intermarket analysis, and future targets for the full scoop. 🔗👇
⚠️ Trading Alert: News & Position Safety 📰
News drops can shake the market! To protect your loot:
Skip new trades during news releases.
Use trailing stops to secure profits and limit losses. 🚫
Join the Heist! 💥
Support our robbery plan—hit the Boost Button! 🚀 Let’s stack cash with ease using the Thief Trading Style. 💪🤝 Stay sharp for the next heist plan, bandits! 🤑🐱👤🎉

long nzdchfif 4hr candle closes as bullish in the next 20mins. buy nzdchf with TIGHT STOP. use today's low as your sl

NZD/CHFPrice action trading is a methodology in financial markets where traders make decisions based on the actual price movements of an asset over time, rather than relying heavily on technical indicators or fundamental analysis. It involves observing and interpreting patterns and trends in price charts to predict future price movements.

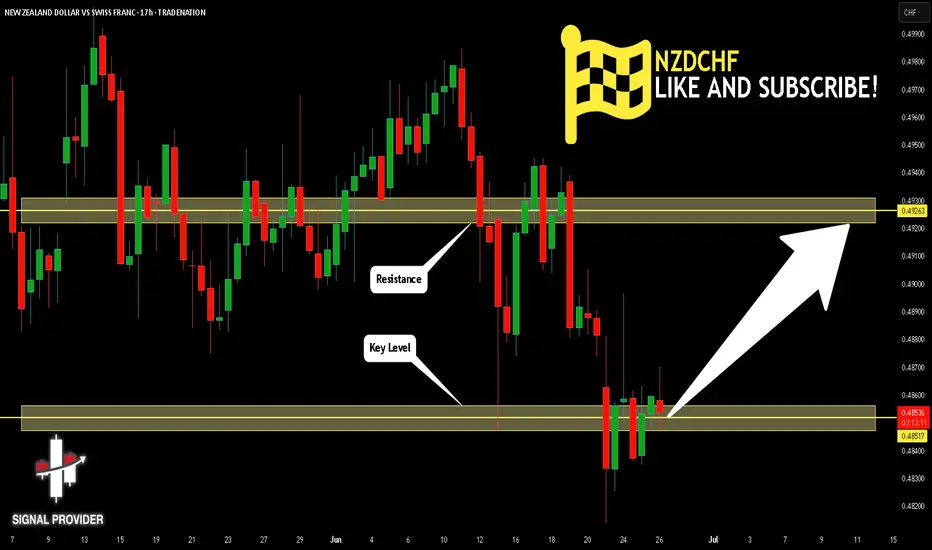
NZDCHF Is Very Bullish! Buy!
Take a look at our analysis for NZDCF
Time Frame: 17h
Current Trend: Bullish
Sentiment: Oversold (based on 7-period RSI)
Forecast: Bullish
The market is testing a major horizontal structure 0.485.
Taking into consideration the structure & trend analysis, I believe that the market will reach 0.492 level soon.
P.S
The term oversold refers to a condition where an asset has traded lower in price and has the potential for a price bounce.
Overbought refers to market scenarios where the instrument is traded considerably higher than its fair value. Overvaluation is caused by market sentiments when there is positive news.
Disclosure: I am part of Trade Nation's Influencer program and receive a monthly fee for using their TradingView charts in my analysis.
Like and subscribe and comment my ideas if you enjoy them!
NZD/CHF Potential Bullish Reversal SetupNZD/CHF Potential Bullish Reversal Setup 🔄📈
📊 Chart Analysis:
The chart shows a potential bullish reversal for NZD/CHF, supported by technical patterns and key levels:
🧠 Key Technical Highlights:
🔹 Double Bottom Formation (🟠 Circles)
A clear double bottom pattern can be seen around the 0.48300 support zone, signaling potential reversal from the downtrend.
🔹 Strong Support Zone 📉
Price bounced from a historically respected support zone (~0.48200–0.48400), which held several times in the past (marked with green arrows).
🔹 Downtrend Breakout 🔺
A short-term bearish channel has been broken to the upside, indicating potential bullish pressure.
🔹 Target Zone 🎯
Immediate bullish target is around 0.49265, aligning with previous resistance.
🔹 Resistance Area (🔵 Boxes)
Next significant resistance lies at 0.49400–0.49800, which may act as the next hurdle if price breaks the 0.49265 level.
✅ Conclusion:
As long as price holds above 0.48400, bulls may aim for the 0.49265 🎯 target. A breakout above that level can open the path to higher resistances.
📌 Bullish Bias maintained above support zone — monitor for volume confirmation and retest strength.

NZD/CHF SENDS CLEAR BULLISH SIGNALS|LONG
Hello, Friends!
NZD/CHF pair is trading in a local downtrend which we know by looking at the previous 1W candle which is red. On the 1D timeframe the pair is going down too. The pair is oversold because the price is close to the lower band of the BB indicator. So we are looking to buy the pair with the lower BB line acting as support. The next target is 0.496 area.
Disclosure: I am part of Trade Nation's Influencer program and receive a monthly fee for using their TradingView charts in my analysis.
✅LIKE AND COMMENT MY IDEAS✅

Shorting Trend looks to do going short matching on 3 timeframes. Just waiting for a good entry signal. We all know anything can happen. Let’s see.

nzdchf long 2nd attempt, should be able to make up previous loss + more
entry .48390
sl .47700
tp .50400

NZDCHF 5R Hit – GBPNZD Missed 8R by PipsPosted both setups Friday — NZDCHF hit full 5R TP today ✅. GBPNZD missed my buy limit by a few pips and then ran 8R 🚀.
That’s trading. Structure was respected. Plan played out. Process trusted. Let’s go again this week. 🔁

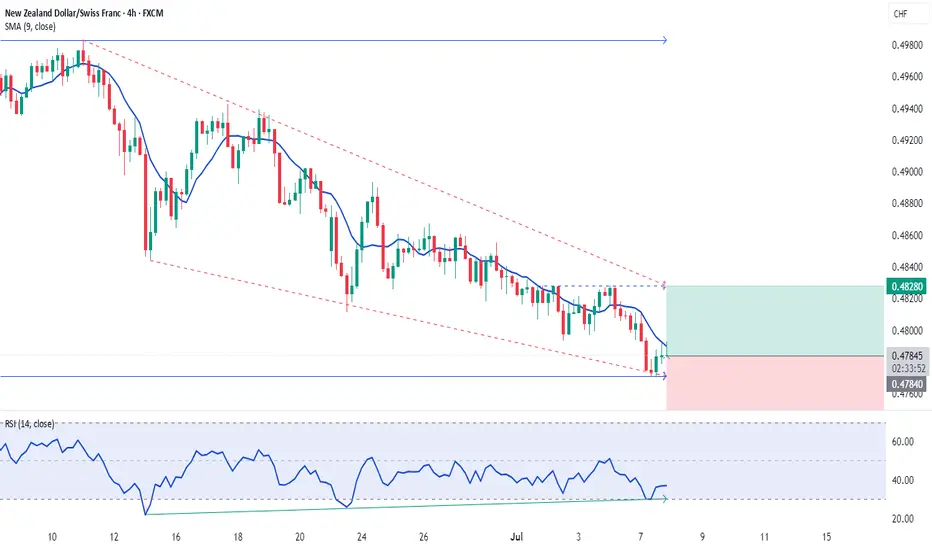
NZDCHF Analysis – “Kiwi Faces Uphill Battle Against Safe-Haven FNZDCHF Price has formed a bearish pennant / triangle after a strong drop from the highs around 0.4960.
Rejection seen from the trendline resistance at ~0.4900, suggesting limited bullish momentum.
Bearish targets are mapped to:
0.4847 (first support)
0.4819 (deeper bearish target)
Two bearish scenarios drawn, both suggesting downside pressure is likely if support breaks.
Structure Bias: Bearish as long as below ~0.4905
📊 Current Bias: Bearish
🧩 Key Fundamentals Driving NZDCHF
NZD Side (Mixed to Weak):
RBNZ held rates at 5.50%, but no additional hawkish surprises. Kiwi is underperforming against safe-havens despite resilience.
Mixed Chinese influence: Some recent recovery in China’s retail/consumption data (e.g., 618 festival) but not strong enough to fuel Kiwi strength.
Risk sentiment: Global geopolitical tensions (Israel-Iran, Ukraine) are pressuring high-beta currencies like NZD.
CHF Side (Strengthening):
Swiss Franc bid on risk-off: CHF is strengthening as a safe-haven due to escalating geopolitical concerns and volatile global markets.
SNB not cutting yet: Recent SNB assessment indicates gradual, patient stance. The central bank may ease later in 2025, but no urgency.
European proximity flows: CHF benefits from proximity to EU and low volatility in domestic economy.
⚠️ Risks That May Reverse the Trend
Surprise RBNZ hawkish speech or inflation spike
Risk-on reversal boosting NZD
Unexpected SNB rate cut or dovish surprise
🗓️ Key News to Watch
🇳🇿 NZ Trade Balance and inflation expectations
🇨🇭 Swiss inflation data and SNB commentary
Global sentiment drivers: Middle East headlines, equity volatility
🏁 Which Asset May Lead?
NZDCHF may lag behind NZDJPY or AUDCHF in volatility but offers a cleaner risk-off signal. If CHF strength and Kiwi weakness persist, this pair can trend with limited noise.

NZD-CHF Rebound Ahead! Buy!
Hello,Traders!
NZD-CHF made a retest
Of the horizontal support
Level of 0.4847 from where
We are already seeing a
Bullish rebound so we are
Locally bullish biased and
We will be expecting a
Further bullish move up
Buy!
Comment and subscribe to help us grow!
Check out other forecasts below too!
Disclosure: I am part of Trade Nation's Influencer program and receive a monthly fee for using their TradingView charts in my analysis.

Trade Idea: Sell NZD/CHF (Still in Play) **📉 Trade Idea: Sell NZD/CHF (Still in Play)**
**Bias:** 🔻 Bearish
**Timeframe:** 🧭 Short-to-Medium Term
---
### **💡 Why Sell NZD/CHF?**
*(Already shared before — and it's working so far ✅)*
**🇳🇿 New Zealand Dollar (NZD):**
* **Global risk-off + weak China demand**
→ *🌍📉 Bad mix for the Kiwi — pressure from all sides.*
* **RBNZ cut rates to 3.25%, may go lower**
→ *📉 Clearly in easing mode — no support from policy.*
* **GDP due June 23 — big swing factor**
→ *📅 Until then, no real reason to be bullish.*
* **Dairy & China exposure still weighing**
→ *🐄🇨🇳 Old headwinds, still blowing.*
* **Market sentiment: Bearish**
→ *🟥 Traders expecting more weakness — and so far, they’re right.*
---
**🇨🇭 Swiss Franc (CHF):**
* **Risk-off flows help CHF — but not strongly**
→ *🛡️ Some safe-haven demand, though capped by the SNB's soft stance.*
* **SNB cut rates to 0%, may go negative again**
→ *💤 Ultra-dovish tone, but market already priced it in.*
* **Flat inflation, soft GDP**
→ *📊 Weak data, but no fresh downside pressure yet.*
* **On U.S. watchlist for FX manipulation**
→ *👀 Adds possible SNB intervention risk — something to monitor.*
* **Market tone: Neutral**
→ *⚖️ CHF not charging higher, but holding its ground. Enough to beat the Kiwi.*
---
### **🔍 Outlook:**
The **fundamental match-up favors the franc over the Kiwi** — even with the SNB being dovish. NZD is just weaker right now, and as long as GDP doesn’t surprise to the upside, this short trade still has room to run.
---
**📌 Note:**
> *“This setup’s been behaving nicely — not flashy, but steady. Until NZ GDP proves otherwise, I’m staying with the trend.”*

NZDCHF Bearish bias Bearish Daily
4H break of trend line = bearish
50 ema above price
50 % fib level
For entry,
Targeting 1:1 RRR