NZDCHF Short Term Buy IdeaH4 - Bullish trend pattern
Currently it looks like a pullback is happening
Until the strong support zone holds my short term view remains bullish here.
NZDCHF trade ideas

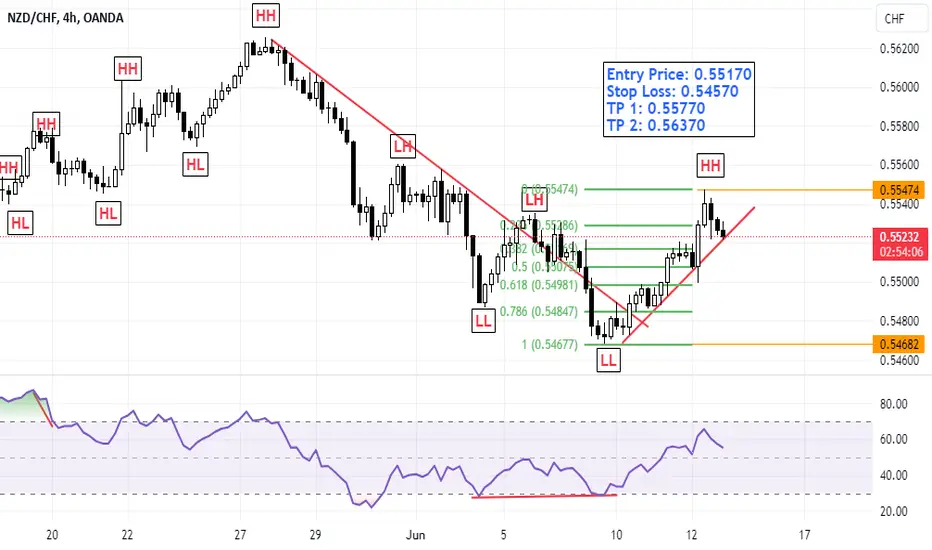
NZDCHF-Position for LongThe pair broke it's downtrend on 4H timeframe and made a HH. Currently the pair is on it's way to print it's HL at 0.38 fib retracement (high probability). After hitting the fib level wait for some bullish candle foramtion before taking an entry. The mentioned levels are of fib retracement with SL and TP.
NZD/CHF For Bearish you can go short now and take any target
- General Trend is Down
- Price Created Lower High
- Price Finish pull-back
- CHF is Strong
have fun :)

The NZDCHF IS A SHORTDo to the fact that NZDCHF finance record from price action shows that it as always been weak .. and its recent up move from last year August was built on a random economics event.. and finally the CHF economics news exposed it's weak accounting shown on the price action

Heading into an overlap resistance, could it reverse from here?NZD/CHF is rising towards the pivot which has been identified as an overlap resistance and could reverse to the 1st support.
Pivot: 0.55294
1st Support: 0.54666
1st Resistance: 0.55747
Risk Warning:
Trading Forex and CFDs carries a high level of risk to your capital and you should only trade with money you can afford to lose. Trading Forex and CFDs may not be suitable for all investors, so please ensure that you fully understand the risks involved and seek independent advice if necessary.
Disclaimer:
The above opinions given constitute general market commentary, and do not constitute the opinion or advice of IC Markets or any form of personal or investment advice.
Any opinions, news, research, analyses, prices, other information, or links to third-party sites contained on this website are provided on an "as-is" basis, are intended only to be informative, is not an advice nor a recommendation, nor research, or a record of our trading prices, or an offer of, or solicitation for a transaction in any financial instrument and thus should not be treated as such. The information provided does not involve any specific investment objectives, financial situation and needs of any specific person who may receive it. Please be aware, that past performance is not a reliable indicator of future performance and/or results. Past Performance or Forward-looking scenarios based upon the reasonable beliefs of the third-party provider are not a guarantee of future performance. Actual results may differ materially from those anticipated in forward-looking or past performance statements. IC Markets makes no representation or warranty and assumes no liability as to the accuracy or completeness of the information provided, nor any loss arising from any investment based on a recommendation, forecast or any information supplied by any third-party.

NZD CHF - Long Set UpLooks like a reversal on 1H TF. Have my entry on break of HH. Have my buy stop / entry at 0.54989.
Entry 0.54989
Stoploss 0.54863
TP-1 0.55119
TP-2 0.55247
#Trading #Technical #Crypto #Stocks #commodities

shortAfter a new lower low we are currently retesting the resistance zone with at the some zone the fib lvl

NZDCHF is BullishPrice was in a strong downtrend, but now bulls seem to have woken up and are trying to gain control. After the emergence of bullish divergence, a couple of higher highs have formed indicating that a bullish reversal is on the cards. If previous higher high is broken, we can expect a bullish rally. Targets are mentioned on the chart.

NZDCHF I Pullback and possible swing long continuation Welcome back! Let me know your thoughts in the comments!
** NZDCHF Analysis - Listen to video!
We recommend that you keep this pair on your watchlist and enter when the entry criteria of your strategy is met.
Please support this idea with a LIKE and COMMENT if you find it useful and Click "Follow" on our profile if you'd like these trade ideas delivered straight to your email in the future.
Thanks for your continued support!Welcome back! Let me know your thoughts in the comments!

NZDCHF: Long Signal Explained
NZDCHF
- Classic bullish formation
- Our team expects pullback
SUGGESTED TRADE:
Swing Trade
Long NZDCHF
Entry - 0.5493
Sl - 0.5470
Tp - 0.5541
Our Risk - 1%
Start protection of your profits from lower levels
❤️ Please, support our work with like & comment! ❤️

NZDCHF- Bullish BiasAfter a long beraish trend the pair had shown signs of reversal with bullish divergence, break of trendline. In confirmation the NewZealand index is also bullish. But entry can be only taken at break of LH just to confirm the starting of uptrend.

NZDCHF Set To Grow! BUY!
My dear followers,
I analysed this chart on NZDCHF and concluded the following:
The market is trading on 0.5520 pivot level.
Bias - Bullish
Technical Indicators: Both Super Trend & Pivot HL indicate a highly probable Bullish continuation.
Target - 0.5563
Safe Stop Loss - 0.5491
About Used Indicators:
A super-trend indicator is plotted on either above or below the closing price to signal a buy or sell. The indicator changes color, based on whether or not you should be buying. If the super-trend indicator moves below the closing price, the indicator turns green, and it signals an entry point or points to buy.
———————————
WISH YOU ALL LUCK

Reversal EntryRight now price is at a 4h Range so I’m patiently wait for price to fill in the OB Above and wait for an entry In the opposite direction before I take a sell

NZD/CHF may fall 19 - 28 pipsOur pivot point stands at 0.5536.
Our preference
The downside prevails as long as 0.5536 is resistance.
Alternative scenario
Above 0.5536, look for 0.5550 and 0.5559.
Comment
The RSI is below 50. The MACD is negative and below its signal line. The configuration is negative. Moreover, the price stands below its 20 and 50 period moving average (respectively at 0.5537 and 0.5539). Finally, the NZD/CHF has penetrated its lower Bollinger band (0.5521).
Supports and resistances
0.5559 **
0.5550 *
0.5536 **
0.5531
0.5519 last
0.5500
0.5491 **
0.5483 *
0.5474 **
Number of asterisks represents the strength of support and resistance levels.

SELL NZDCHF - 35 pipsThere has been historic support and resistance within the zones marked on the setup above. This was a late entry and will still respect the stop loss and take profit zones.
Thanks
Don

NZDCHF: Long Trade Explained
NZDCHF
- Classic bullish setup
- Our team expects bullish continuation
SUGGESTED TRADE:
Swing Trade
Long NZDCHF
Entry Point - 0.5509
Stop Loss - 0.5480
Take Profit - 0.5564
Our Risk - 1%
Start protection of your profits from lower levels
❤️ Please, support our work

NZDCHF - CHANGE OF CHARACTERHello Traders !
The NZDCHF price failed to create a new higher high !
The higher low is broken (Change of Character).
The support line is broken!
So, I expect a bearish move📉
----------------
TARGET: 0.55120🎯

NZD/CHFLooking to short the market once i get that third touch since price has broken previous low and closed below .

NZDCHFIs NZDCHF exhausting at resistance zone?
As the price is been on high bull run but now it seems like price is lacking bullish momentum after printing double top pattern at resistance level and bearish divergence( on lower time frame) suggesting the sell pressure is about to start.
If the bears took control , the 1st target could be 0.5400
What you guys think of it?

SELL NZDCHF - trade explained in detailTrader Tom, an investing.com technical analyst with over 15 years’ experience, explains his trade idea using price action and a top down approach. This is one of many trades so if you would like to see more then please follow us and hit the boost button.

NZDCHF BREAKOUT AND PULLBACK ON KEY LEVELWe recently observed a significant breakout and rally at a crucial level, followed by a price reversal back toward this key level where the initial breakout was confirmed. We now anticipate a retest of this level, expecting it to act as a support zone before another bullish reversal occurs.

NZDCHF – looking for pullback and bullish continuationThe recent bullish move by this pair has been restricted by the resistance zone around 0.54750. However, this zone was overcome about 2 weeks ago. After breaking through with momentum, price is now pulling back and I think it will find support at the same zone aided by the 50EMA.
Let’s see how this plays out.
This is not a trade recommendation.
Trading carries a high level of risk, so only trade with money you can afford to lose. Anything can happen in the markets at any time. Please use sound money and risk management in all your trades.
If you like my idea, please give a “boost” and follow me to get even more.
Please comment and share your thoughts too!!

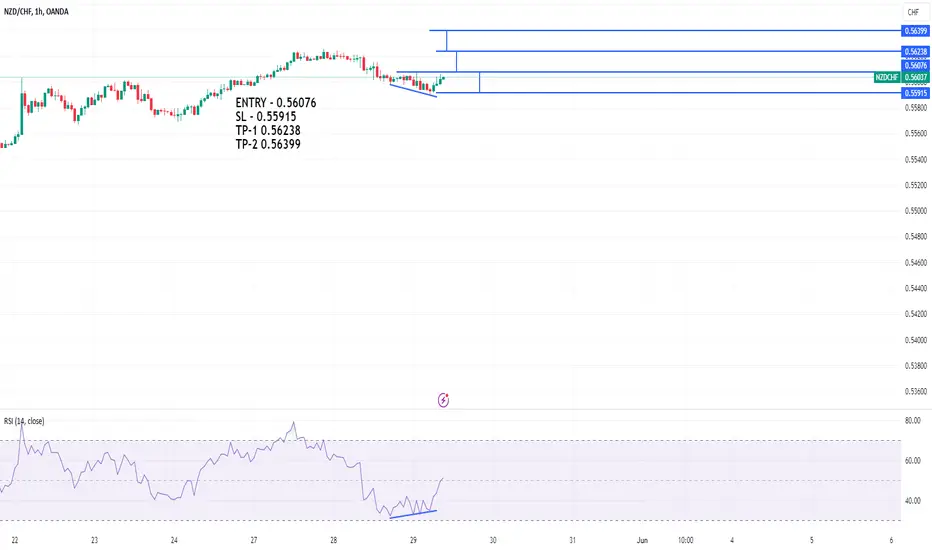
NZD CHF - 1H Time Frame - Long SetupOn 1H TF forming a bullish divergence. If we break the previous LH (0.56076).Entry / buy stop will trigger. If new lows are formed. The set up is invalidated. Good Luck