NZD/CHF Ready To Go Down Hard , Don`t Miss 250 Pips !Here is my chart on NZD/CHF And it`s very clear short setup after this amazing bearish closure below my second support , so i think this pair will go down hard for the next days and weeks , let`s sell this pair and see what will happen !
This Is An Educational + Analytic Content That Will Teach Why And How To Enter A Trade
Make Sure You Watch The Price Action Closely In Each Analysis As This Is A Very Important Part Of Our Method
Disclaimer : This Analysis Can Change At Anytime Without Notice And It Is Only For The Purpose Of Assisting Traders To Make Independent Investments Decisions.
NZDCHF trade ideas

Carry Trade Imbalance NZD/CHFNZD has a high interest rate (around 5.5% as of 2025), as New Zealand is battling inflation and maintaining tight monetary policy.
CHF has a very low or even negative interest rate (Switzerland traditionally keeps rates low due to deflationary tendencies and currency stability).
📉 Current Imbalance:
The NZD/CHF currency pair is at historically low levels, meaning the Swiss franc is too strong relative to the New Zealand dollar.
This is a fundamental imbalance, because NZD should be stronger (higher yield = more attractive asset). and gain big SWAP
💼 Carry Trade:
This is a perfect setup for a carry trade: borrow CHF at low interest and invest in NZD at high interest.
When this type of trading becomes popular, it puts upward pressure on the pair – NZD is bought, CHF is sold.
📈 Conclusion:
NZD/CHF has potential to rise:
To correct the fundamental imbalance.
Because the market may shift toward carry trades.
If central banks (especially SNB) remain dovish, while RBNZ stays hawkish.

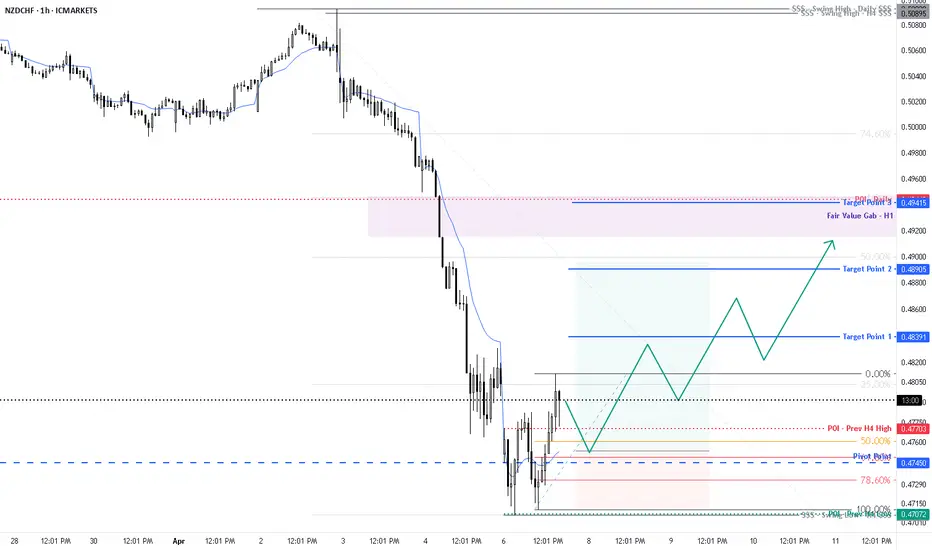
NZDCHF LONG POSITIONLooking at a long poition on this pair, we have cleared internal liquidity which we are now expecting a run to the upside.

NZDCHF: Will Start Falling! Here is Why:
The recent price action on the NZDCHF pair was keeping me on the fence, however, my bias is slowly but surely changing into the bearish one and I think we will see the price go down.
Disclosure: I am part of Trade Nation's Influencer program and receive a monthly fee for using their TradingView charts in my analysis.
❤️ Please, support our work with like & comment! ❤️

NZD/CHF For Bullishwait for pull-back near by entry point and then go long
general trend is up trend
have fun :)

NzdChf-GbpNzdThere is a small correlation between the two. If the zones hold and the highs/lows are broken then the analysis holds.

NZDCHF LONGWe are on a support zone. hoping buy at support and get over 100 pips yo those zones. Lets see what will happens

buy limit position on NZDCHFwe are waiting for trend line reaction by the pair to enter long .
our suggested position is buy limit with RR>3 upon market opening
the key level for reaction is fibo 76.4%
lets see what the market reaction

NZDCHF: Bear Trap & Pullback From Support 🇳🇿🇨🇭
It looks like we have a bearish trap on NZDCHF after
a test of a key daily support.
The price went way below that but recovered steadily,
forming a double bottom pattern.
A formation of a bullish imbalance candle on an hourly
indicate a very likely bullish movement.
Goal - 0.5035
❤️Please, support my work with like, thank you!❤️
I am part of Trade Nation's Influencer program and receive a monthly fee for using their TradingView charts in my analysis.

NZD-CHF Free Signal! Sell!
Hello,Traders!
NZD-CHF is going down
And the pair made a bearish
Breakout and it is confirmed
So we are bearish biased
And we can enter a short
Trade with the Take Profit
Of 0.5018 and the Stop
Loss of 0.5060
Sell!
Comment and subscribe to help us grow!
Check out other forecasts below too!
Disclosure: I am part of Trade Nation's Influencer program and receive a monthly fee for using their TradingView charts in my analysis.

NZDCHF is in the Bearish Side Hello Traders
In This Chart NZDCHF HOURLY Forex Forecast By FOREX PLANET
today NZDCHF analysis 👆
🟢This Chart includes_ (NZDCHF market update)
🟢What is The Next Opportunity on NZDCHF Market
🟢how to Enter to the Valid Entry With Assurance Profit
This CHART is For Trader's that Want to Improve Their Technical Analysis Skills and Their Trading By Understanding How To Analyze The Market Using Multiple Timeframes and Understanding The Bigger Picture on the Chart

NZDCHFStill in downtrend, waiting for good pullback, second is break of latest Low in 4H timeframe, rejection to the upside then we attack the market targetting the next structure.

NZDCHF TRADE SETUPWait for retest the entry level then take a trade for Sell otherwise skip this setup

NZDCHF: Long Signal Explained
NZDCHF
- Classic bullish setup
- Our team expects bullish continuation
SUGGESTED TRADE:
Swing Trade
Long NZDCHF
Entry Point - 0.5035
Stop Loss - 0.5019
Take Profit - 0.5065
Our Risk - 1%
Start protection of your profits from lower levels
Disclosure: I am part of Trade Nation's Influencer program and receive a monthly fee for using their TradingView charts in my analysis.
❤️ Please, support our work with like & comment! ❤️

NZD_CHF BEARISH BREAKOUT|
✅NZD_CHF made a bearish
Breakout of the key horizontal level
and the breakout is confirmed so we
are bearish biased and we will be expecting a
Further bearish move down
SHORT🔥
✅Like and subscribe to never miss a new idea!✅
Disclosure: I am part of Trade Nation's Influencer program and receive a monthly fee for using their TradingView charts in my analysis.

NZD/CHF NEXT MOVESell after bearish candle stick pattern, buy after bullish candle stick pattern....
Best bullish pattern , engulfing candle or green hammer
Best bearish pattern , engulfing candle or red shooting star
NOTE: IF YOU CAN'T SEE ANY OF TOP PATTERN IN THE ZONE DO NOT ENTER
Stop lost before pattern
R/R %1/%3
Trade in 5 Min Timeframe, use signals for scalping

NZD/CHF BEARS ARE GAINING STRENGTH|SHORT
Hello, Friends!
We are going short on the NZD/CHF with the target of 0.503 level, because the pair is overbought and will soon hit the resistance line above. We deduced the overbought condition from the price being near to the upper BB band. However, we should use low risk here because the 1W TF is green and gives us a counter-signal.
Disclosure: I am part of Trade Nation's Influencer program and receive a monthly fee for using their TradingView charts in my analysis.
✅LIKE AND COMMENT MY IDEAS✅

Bullish bounce?NZD/CHF is falling towards the support level which is an overlap support and could bounce from this level to our take profit.
Entry: 0.50509
Why we like it:
There is an overlap support level.
Stop loss: 0.50258
Why we like it:
There is a pullback support level that is slightly below the 138.2% Fibonacci retracement.
Take profit: 0.50903
Why we like it:
There is a pullback resistance level.
Enjoying your TradingView experience? Review us!
Please be advised that the information presented on TradingView is provided to Vantage (‘Vantage Global Limited’, ‘we’) by a third-party provider (‘Everest Fortune Group’). Please be reminded that you are solely responsible for the trading decisions on your account. There is a very high degree of risk involved in trading. Any information and/or content is intended entirely for research, educational and informational purposes only and does not constitute investment or consultation advice or investment strategy. The information is not tailored to the investment needs of any specific person and therefore does not involve a consideration of any of the investment objectives, financial situation or needs of any viewer that may receive it. Kindly also note that past performance is not a reliable indicator of future results. Actual results may differ materially from those anticipated in forward-looking or past performance statements. We assume no liability as to the accuracy or completeness of any of the information and/or content provided herein and the Company cannot be held responsible for any omission, mistake nor for any loss or damage including without limitation to any loss of profit which may arise from reliance on any information supplied by Everest Fortune Group.

NZD/CHF NEXT MOVESell after bearish candle stick pattern, buy after bullish candle stick pattern....
Best bullish pattern , engulfing candle or green hammer
Best bearish pattern , engulfing candle or red shooting star
NOTE: IF YOU CAN'T SEE ANY OF TOP PATTERN IN THE ZONE DO NOT ENTER
Stop lost before pattern
R/R %1/%3
Trade in 5 Min Timeframe, use signals for scalping

BUY NZDCHFThe common idea is that, if the price is in upward move, when it breaks above, wait until it retraces to the original move, then if in the LTF it gives an entry, dive in with buys. Remember to use risk management
Bearish reversal?NZD/CHF is rising towards the pivot and could reverse to the 1st support.
Pivot: 0.50899
1st Support: 0.50213
1st Resistance: 0.51110
Risk Warning:
Trading Forex and CFDs carries a high level of risk to your capital and you should only trade with money you can afford to lose. Trading Forex and CFDs may not be suitable for all investors, so please ensure that you fully understand the risks involved and seek independent advice if necessary.
Disclaimer:
The above opinions given constitute general market commentary, and do not constitute the opinion or advice of IC Markets or any form of personal or investment advice.
Any opinions, news, research, analyses, prices, other information, or links to third-party sites contained on this website are provided on an "as-is" basis, are intended only to be informative, is not an advice nor a recommendation, nor research, or a record of our trading prices, or an offer of, or solicitation for a transaction in any financial instrument and thus should not be treated as such. The information provided does not involve any specific investment objectives, financial situation and needs of any specific person who may receive it. Please be aware, that past performance is not a reliable indicator of future performance and/or results. Past Performance or Forward-looking scenarios based upon the reasonable beliefs of the third-party provider are not a guarantee of future performance. Actual results may differ materially from those anticipated in forward-looking or past performance statements. IC Markets makes no representation or warranty and assumes no liability as to the accuracy or completeness of the information provided, nor any loss arising from any investment based on a recommendation, forecast or any information supplied by any third-party.

NZDCHF: Bullish Continuation
Looking at the chart of NZDCHF right now we are seeing some interesting price action on the lower timeframes. Thus a local move up seems to be quite likely.
Disclosure: I am part of Trade Nation's Influencer program and receive a monthly fee for using their TradingView charts in my analysis.
❤️ Please, support our work with like & comment! ❤️
