EURNZD TRADE SETUPWait for retest the entry level and bullish momentum then take a trade for Buy otherwise skip this setup
NZDEUR trade ideas
EURNZD: Bears Will Push Lower
Balance of buyers and sellers on the EURNZD pair, that is best felt when all the timeframes are analyzed properly is shifting in favor of the sellers, therefore is it only natural that we go short on the pair.
Disclosure: I am part of Trade Nation's Influencer program and receive a monthly fee for using their TradingView charts in my analysis.
❤️ Please, support our work with like & comment! ❤️

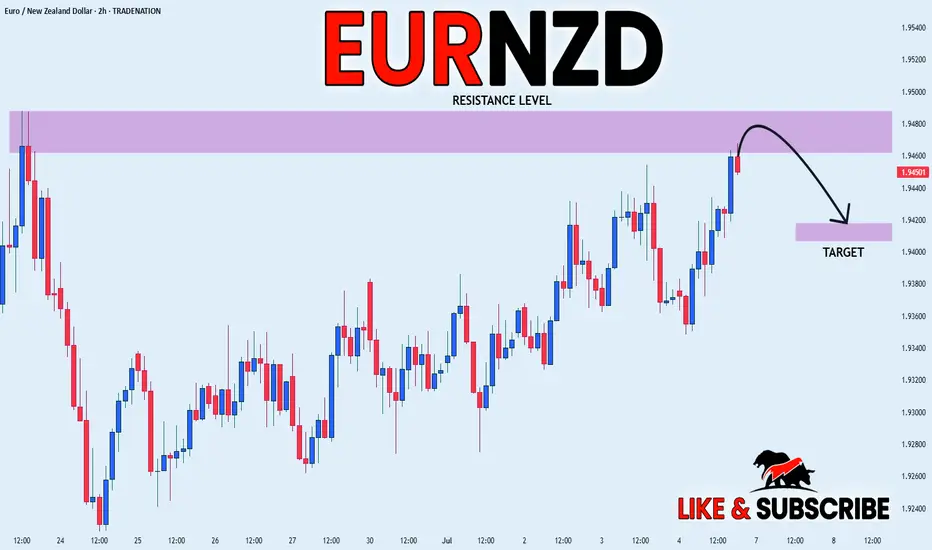
Eur/nzd sell on 1hr 2hr 3hr 4hr charts The chart structure is showing double top with nice liquidity spikes, high volume on the sell side , this looks a decent chance to sell at 1.94375 then I'm looking for tp at around 1.93434 area look for signal to tp. 😊

EUR_NZD LOCAL SHORT|
✅EUR_NZD is set to retest a
Strong resistance level above at 1.9488
After trading in a local uptrend for some time
Which makes a bearish pullback a likely scenario
With the target being a local support below at 1.9420
SHORT🔥
✅Like and subscribe to never miss a new idea!✅
Disclosure: I am part of Trade Nation's Influencer program and receive a monthly fee for using their TradingView charts in my analysis.
EURNZD SELL Signal. Don't forget about stop-loss.
Write in the comments all your questions and instruments analysis of which you want to see.
Friends, push the like button, write a comment, and share with your mates - that would be the best THANK YOU.
P.S. I personally will open entry if the price will show it according to my strategy.
Always make your analysis before a trade

EUR/NZD Robbery Blueprint – Targeting Pink Zone Profits💰EUR/NZD Robbery Setup: The Bullish Breakout Blueprint for Euro vs Kiwi Heist! 🚨📈
(Targeting High-Risk Zones With Dynamic Entry & Exit Tactics – Long Setup Explained)
🌟Hi! Hola! Ola! Bonjour! Hallo! Marhaba!🌟
Dear Market Pirates & Chart Bandits, 🏴☠️💸📊
Ready to rob the Kiwi vaults with precision? Based on our 🔥Thief Trading Strategy🔥 (technical + fundamental), here’s the grand blueprint for the EUR/NZD Long Heist. We’ve scoped the market, sniffed out consolidation traps, and locked eyes on that Pink Zone of high-risk, high-reward. The bulls are regrouping. This is our moment. 📍
🎯 ENTRY PLAN – “The Breakout Is The Lock Pick”
📈 Strike Price: 1.93900
Wait for a clean candle close above the Major Dynamic Resistance (MA level).
Once breached, place buy stop orders above the MA line — entry must align with breakout rules.
🔁 Optional: For early robbers, place buy limits on the nearest swing low within the 15M or 30M timeframe (confirmation from wick rejections).
📌 Set alerts (📳) at breakout zones. Stay sharp. Opportunity doesn't knock—it smashes doors.
🛑 STOP LOSS – “Protection Is Power”
Set your SL near the previous swing High/Low wick (4H chart zone), aligning it with your personal lot size, risk %, and number of trades.
📍“SL is your vault lock. Set it smart, not soft. You’re not gambling — you’re robbing with logic.”
🔥 Reminder: No premature SL on pending orders—wait for breakout validation.
🧨 TARGET – “Escape Plan”
🎯 Profit Target: 1.97500
Or dip out early if resistance alarms start ringing. 🏃♂️💨
⚖️ OVERVIEW – “The Scoreboard”
The EUR/NZD is currently in a neutral chop, but multiple trend reversal signs are emerging.
🔥 Oversold zones, squeeze structure, and a potential bull charge all support this heist-worthy long setup.
📚 BONUS INTEL
Unlock the deeper story:
🧠 Sentiment Analysis
💼 COT Report Data
🌍 Macro Insights
🔍 Intermarket Correlations
📊 Quant Metrics
👉 Followw the 🔗 in the idea for more details and thief-style scoring!
🚨 NEWS ALERTS & POSITION MANAGEMENT
🗞 Avoid new trades during high-impact news. Use trailing SL to protect and lock in gains as the plan moves. Stay adaptive — markets shift fast.
💥 FINAL WORD – “Boost The Gang, Fuel The Plan”
If this heist plan fuels your trading journey, smash the Boost button 💥💖
Help more traders rob the market, not each other.
We operate clean, with precision and thief-style logic.
Let’s get this bag. 💰💼🎉
🧠 Stay tuned for the next operation. Till then — rob smart, rob safe. 🐱👤🤑📈

EURNZD BUY TRADE PLAN🔥 EUR/NZD – 28 June 2025 TRADE PLAN 🔥
📋 Plan Overview
Parameter Details
Type Intra-Day
Direction Long
Status Pending (Awaiting zone tap + confirmation)
R:R 1:3+
Confidence High (85%)
📈 Market Bias
EUR/NZD remains in a bullish structure on H4/D1, consolidating after the breakout above 1.9300 zone. We are looking at a continuation play from a refined M15-H1 demand zone after a minor retrace.
🔰 Confidence Factors
✅ HTF confluence: D1 + H4 bullish structure
✅ M15 OB + H1 BOS
✅ Clear volume alignment — recent breakout supported by high volume
✅ No macro/fundamental contradictions
📍 Entry Zone(s)
🟩 Primary Buy Zone: 1.9315 – 1.9290
(H1 OB + M15 refinement + volume base + inducement layer)
❗ Stop Loss Reasoning
SL: 1.9255
Placed well below the OB + liquidity sweep low, outside minor wicks, beyond noise zone.
🎯 Take Profit Targets
🥇 TP1: 1.9365 (minor H1 structure high, ~50 pips / ~1.5R)
🥈 TP2: 1.9400 (HTF resistance, ~90 pips / ~3R)
🥉 TP3: 1.9450 (extended runner, swing high test)
🧠 Management Logic
Risk 1% of account on this setup
Take 33% at TP1 → move SL to breakeven
Take 33% at TP2 → trail remainder on H1 fractals
Exit all if H1 BOS down confirmed
⚠️ Entry Confirmation Conditions
M15 bullish engulfing or BOS in zone
NY or London session volume spike
Preferable: SMT divergence with correlated pairs
⏳ Trade Validity Window
H1 setup = 12-24 hours
❌ Invalidation
Clean close below 1.9260 on H1
HTF shift bearish (D1 rejection candle, H4 BOS down)
🌐 Macro Snapshot
EUR relatively supported by broader risk tone
NZD quiet macro tone, no key news
Cross: EUR/USD holding above supports
Sentiment score: +7/10 (risk-on bias, no major headwinds)
✅ Summary
👉 Entry Zone: 1.9315–1.9290
👉 SL: 1.9255
👉 TP1: 1.9365
👉 TP2: 1.9400
👉 TP3: 1.9450
👉 Risk: ~30-50 pips
👉 Reward (TP2): ~90+ pips → R:R = 1:3+
Status: Pending zone tap + confirmation

EURNZD analysis elliot. Don't forget about stop-loss.
Write in the comments all your questions and instruments analysis of which you want to see.
Friends, push the like button, write a comment, and share with your mates - that would be the best THANK YOU.
P.S. I personally will open entry if the price will show it according to my strategy.
Always make your analysis before a trade


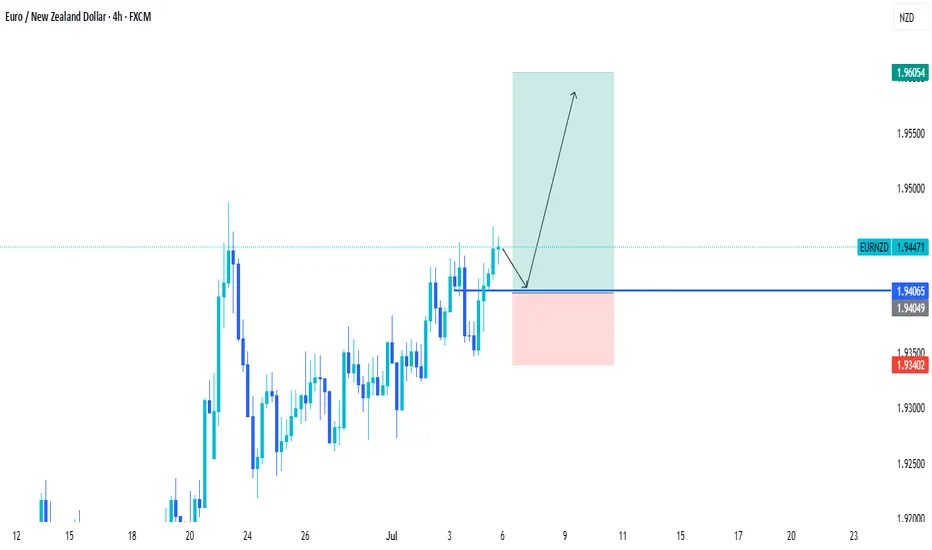
EURNZDEURNZD is maintaining a strong bullish structure, supported by a clean ascending trendline and the 200 EMA, both acting as dynamic support. Price recently pulled back into a key demand zone, which also aligns with trendline support and the EMA — creating a confluence area. As long as this zone holds, we can expect bullish continuation toward the previous swing highs, potentially targeting the 1.9450+ area. A strong rejection from the current level could confirm a fresh impulsive wave upward

EURNZD🎯 EURNZD Setup
Waiting for price to reach our key level.
If we get a buy signal there, I’ll go long. But if the level breaks and we get a proper pullback, I’ll look to short.
No predictions — just reacting with a clear plan and risk control.
🟢 Long on reaction
🔴 Short on break & pullback
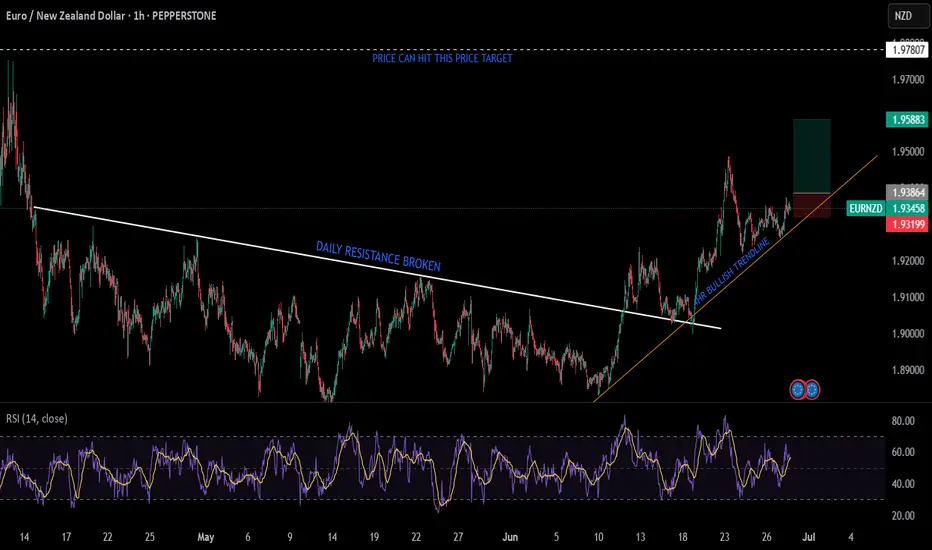
bullish rally for EURNZDas price broke the resistance (daily tf) and then made a decent pullback to retest that level and moved upwards, and now respecting the bullish trendline (4hr tf) also there is no divergence on multiple tfs with no major sign of reversal. All these confluences make this trend a bullish pair. To earn more RR 1hr or 30 min tf would be suitable, as I have also shown the buy stop order on the chart
EUR/NZD SELL TO BUYE/N Is possible to retrace to a certain point of interest to continue the bullish movement .
I will see how it goes .
HappY TrAdiNg

EUR/NZD SELLERS WILL DOMINATE THE MARKET|SHORT
Hello, Friends!
EUR/NZD pair is trading in a local uptrend which we know by looking at the previous 1W candle which is green. On the 17H timeframe the pair is going up too. The pair is overbought because the price is close to the upper band of the BB indicator. So we are looking to sell the pair with the upper BB line acting as resistance. The next target is 1.915 area.
Disclosure: I am part of Trade Nation's Influencer program and receive a monthly fee for using their TradingView charts in my analysis.
✅LIKE AND COMMENT MY IDEAS✅

EUR-NZD Bullish Bias! Buy!
Hello,Traders!
EUR-NZD is trading in a
Strong uptrend and the pair
Is printing higher highs and
Higher lows while breaking
Important key levels such
As 1.9270 which is now
A support and the pair
Is consolidating above the
New support so we are
Bullish biased and we will
Be expecting a further move
Further up on Monday
Buy!
Comment and subscribe to help us grow!
Check out other forecasts below too!
Disclosure: I am part of Trade Nation's Influencer program and receive a monthly fee for using their TradingView charts in my analysis.

EuroNewzealand dollar.. a possible sell to Buy structure Price is still bullish from 4hr structure leg.. but I'll love to see a sell reaction come next week and here is why
From 4hr Timeframe, price has taken out the inducement and is respecting the structure demand level, but 1hr seems to 15min TF seems to be telling that price has invalidated a major bullish leg and will likely go the extreme of the structural leg before continuing the bullish trend
Whatever the price give come next week I'll react accordingly
#SMC concept

EURNZD: Bearish Continuation & Short Trade
EURNZD
- Classic bearish formation
- Our team expects pullback
SUGGESTED TRADE:
Swing Trade
Short EURNZD
Entry - 1.9350
Sl - 1.9422
Tp - 1.9206
Our Risk - 1%
Start protection of your profits from lower levels
Disclosure: I am part of Trade Nation's Influencer program and receive a monthly fee for using their TradingView charts in my analysis.
❤️ Please, support our work with like & comment! ❤️

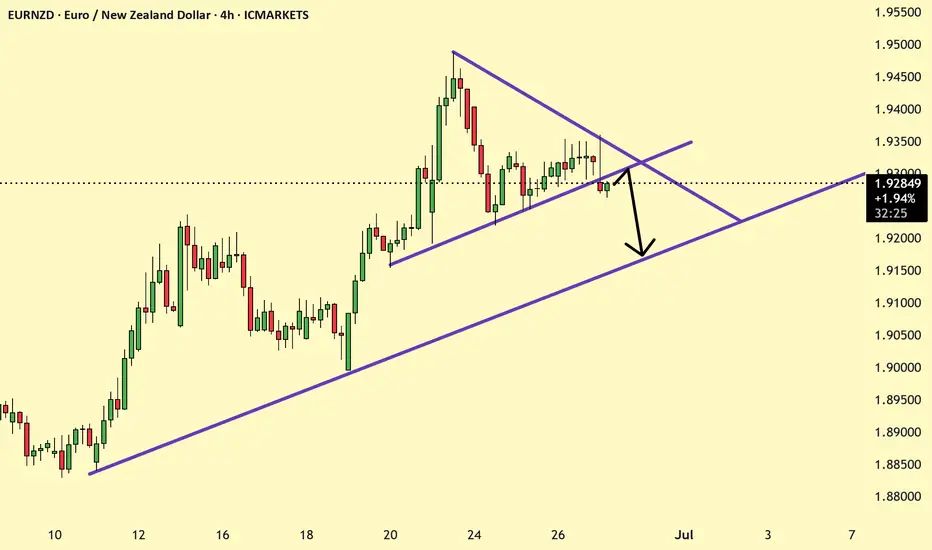
EURNZD Broke the trendline and resetting likely go down Target of 1.92 is possible as inside trend line is broken and currently retesting it.
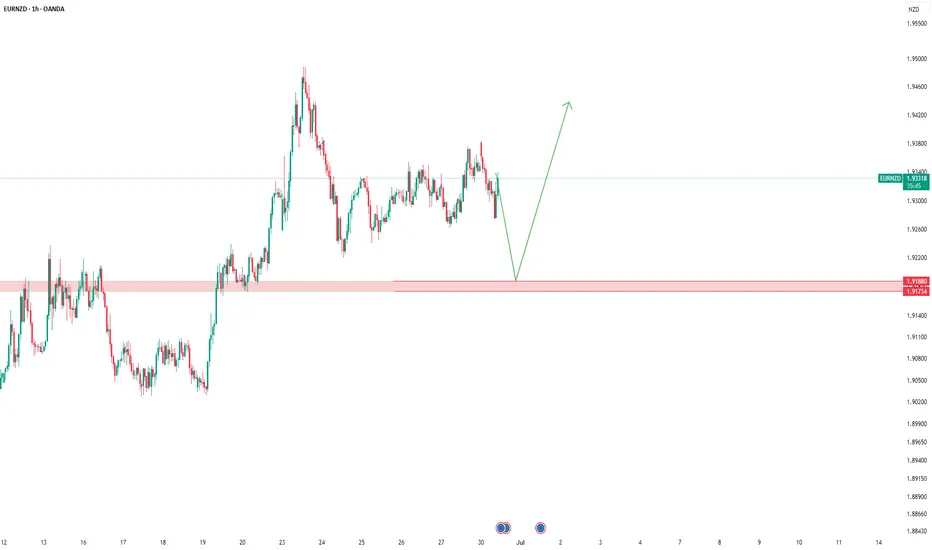
EURNZD Ascending Triangle Breakout: Bullish Continuation SetupThe EURNZD 1-hour chart shows a bullish breakout from an ascending triangle pattern formed between points A, C, and D. Price broke above the descending resistance from point B, indicating bullish momentum. The breakout above the consolidation zone around 1.931 suggests a potential move towards the target of 1.94512. The support is held at 1.92243, while the stop loss is placed below the structure at 1.91916, maintaining a favorable risk-reward ratio.

EURNZD LONG Patiently waiting for EURNZD to dip into my buy zone and clear structural liquidity, then I'll be ready to pounce! Buy limit's set, now it's just a matter of time 📊💡

Long EURNZDEN is in obvious uptrend. Price had retraced into fibo 50% - 61.8% range and came with engulfing candle. Project price will go up gradually to higher high.

EURNZD: Time to Grow 🇪🇺🇳🇿
EURNZD is strongly bullish after a test of a key horizontal support.
A bullish violation of a resistance line of a falling channel provide
a strong bullish signal.
Goal - 1.936
❤️Please, support my work with like, thank you!❤️
I am part of Trade Nation's Influencer program and receive a monthly fee for using their TradingView charts in my analysis.

EURNZD Eyes 1.99 — Technical & Fundamental Bulls AlignedToday, I want to analyze EURNZD ( OANDA:EURNZD ) for you, which is in good shape both technically and fundamentally .
Please stay with me.
EURNZD is moving close to the Support zone(1.88750 NZD-1.7970 NZD) and 100_SMA(Daily) and has managed to form a Double Bottom Pattern .
From the perspective of Elliott Wave theory , EURNZD seems to have completed the main wave 4 , and we should wait for the main wave 5 . The main wave 5 could complete at the Heavy Resistance zone(2.120 NZD-1.9927 NZD) .
-----------------------------------
EURNZD – Fundamental Analysis:
The EURNZD pair currently reflects a divergence between two very different economic outlooks.
Eurozone (EUR):
The European Central Bank (ECB) has recently begun cutting interest rates to support slowing economic activity, especially in the industrial and manufacturing sectors. Despite this dovish shift, inflation remains relatively under control, and the euro has held up well against riskier currencies thanks to global uncertainty and safe-haven flows.
New Zealand (NZD):
New Zealand's economy is under pressure. The latest GDP figures confirmed a weak growth outlook, and signs of a technical recession are mounting. While the Reserve Bank of New Zealand (RBNZ) has maintained a relatively hawkish tone, it faces a dilemma: inflation is sticky, but domestic demand and housing remain fragile. The RBNZ may be forced to soften its stance sooner than expected.
Outlook:
This fundamental backdrop supports a bullish bias for EURNZD. The euro’s relative stability versus the increasingly vulnerable New Zealand dollar makes this pair attractive for long positions — especially if upcoming NZ data disappoints or global risk sentiment weakens further.
-----------------------------------
Based on the above explanation, I expect EURNZD to rise to at least 1.9917 NZD .
Note: Stop Loss(SL): 1.8779 NZD
Please respect each other's ideas and express them politely if you agree or disagree.
Euro/New Zealand Dollar Analyze (EURNZD), Daily time frame.
Be sure to follow the updated ideas.
Do not forget to put a Stop loss for your positions (For every position you want to open).
Please follow your strategy and updates; this is just my Idea, and I will gladly see your ideas in this post.
Please do not forget the ✅' like '✅ button 🙏😊 & Share it with your friends; thanks, and Trade safe.
